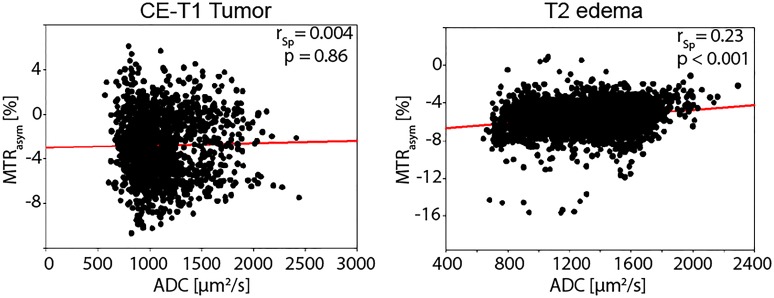
Fig 4. Voxelwise correlation of ADC and MTRasym contrast for patient 6.
The shown scatterplots correspond to the volumetric segmentation of the CE-T1 tumor and T2 peritumoral edema region for an exemplary patient (Patient 6). A linear regression (red line) was additionally plotted for both regions. For the CE-T1 tumor, no correlation could be observed over the 1515 voxel, whereas a weak positive correlation over the 3044 voxel of the T2 edema region of this patient is found. The weakly positive correlation within the T2 edema signifies that high MTRasym values (caused by decreased NOE effects) tend to correspond to high ADC values in this region. The graphs represent the generally observed trend within the patient collective.

