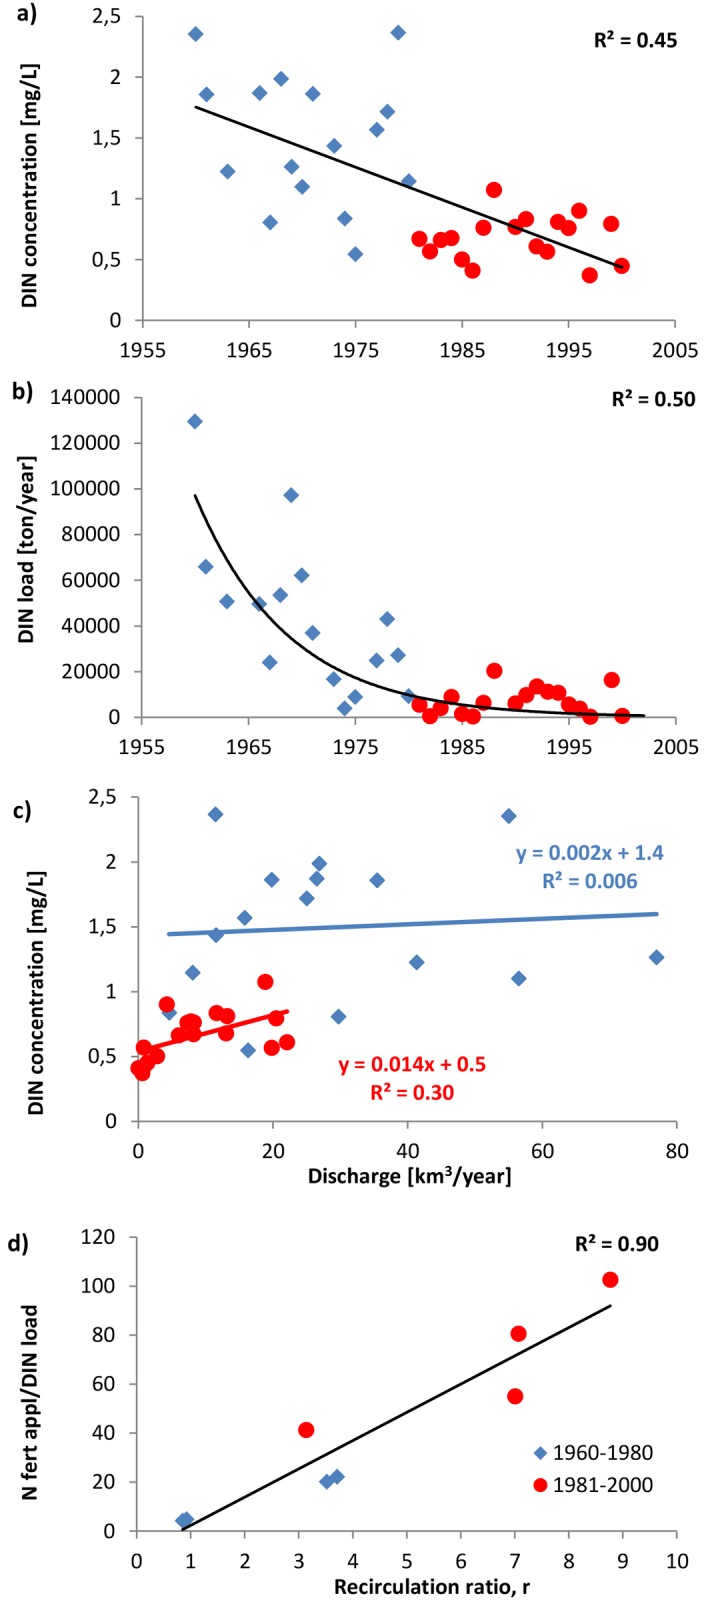
Fig 3. Temporal trend in a) annual mean dissolved inorganic nitrogen (DIN) concentration, and b) annual mean DIN load at Kziljar station, and linear correlation c) between mean annual dissolved inorganic nitrogen (DIN) concentrations and mean annual discharge at Kziljar station for the periods 1960–1980 (blue), 1981–2000 (red) and 1960–2000 (thick black trend line) and d) between five year averages of the ratio of N fertilizer application and DIN load and the recirculation ratio (r) for the Amu Darya River basin for the periods 1960–1980 (blue), and 1981–2000 (red).

