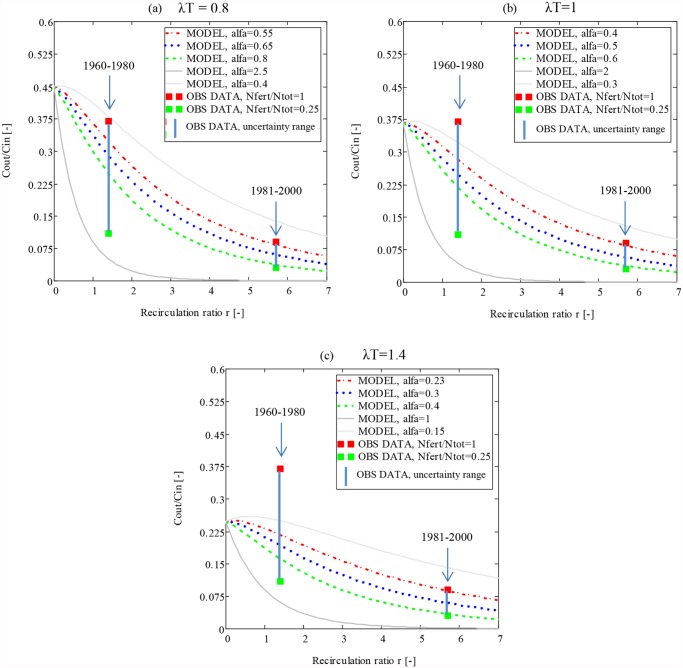
Fig 4. Concentration ratios (Cout(r)/Cin), calculated with Eq 1 in section 2.3, for different recirculation ratios (r), attenuation products (λT) and attenuation constants (α).
Cout(r)/Cin is shown for: a) λT = 0.8; α = 0.4, 0.55, 0.65, 0.8 and 2.5, b) λT = 1; α = 0.3, 0.4, 0.5, 0.6 and 2 and c) λT = 1.4; α = 0.15, 0.23, 0.3, 0.4 and 1. Cout/Cin uncertainty intervals for the two time periods, assuming Nfert/Ntot ranging between 0.25 and 1, are indicated in blue solid lines at r for respective period. r for periods 1960–1980 and 1981–2000 equaled 1 and 6, respectively.

