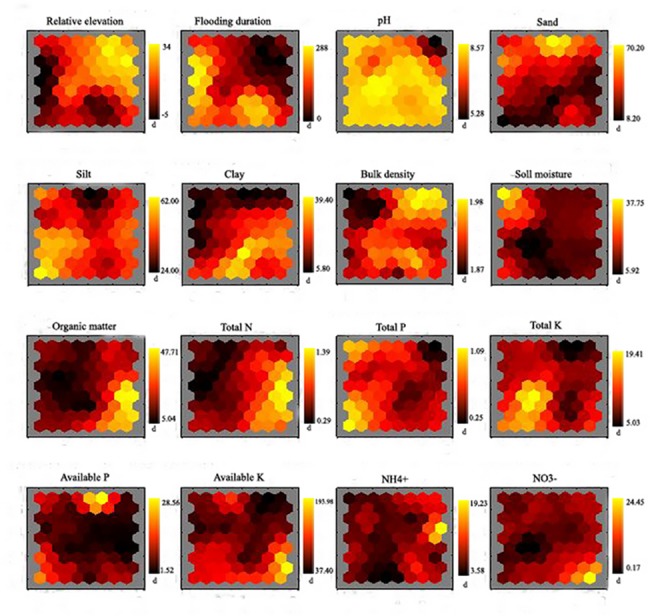
Fig 5. Relationship among concentration of soil parameters, relative elevation, and flooding duration by the visualization of component planes in a SOM after submergence.

Vertical bars in the jet color map present the measure values, i.e., relative elevation in (m), flooding duration in (d), bulk density in (g cm-3), soil moisture and particle size composition in (%), total nutrients in (g kg-1), and available nutrients in (mg kg-1).
