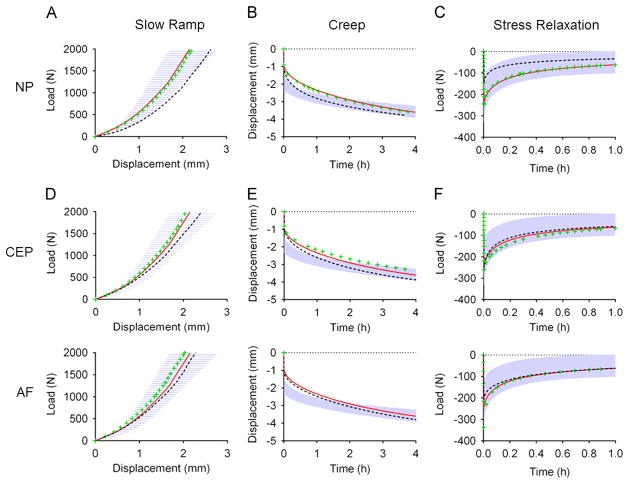
Fig. 6.
Validation of finite element model showing experimental 95% confidence interval (shaded blue) and FE model simulation (red line) in slow ramp, creep and stress Relaxation. The effect on load–displacement response for alterations in NP (A–C), CEP (D–F) and AF (G–I) material properties are shown with the green “+” symbol representing the response with the higher material properties and the black “−” symbol representing the response with the lower properties.

