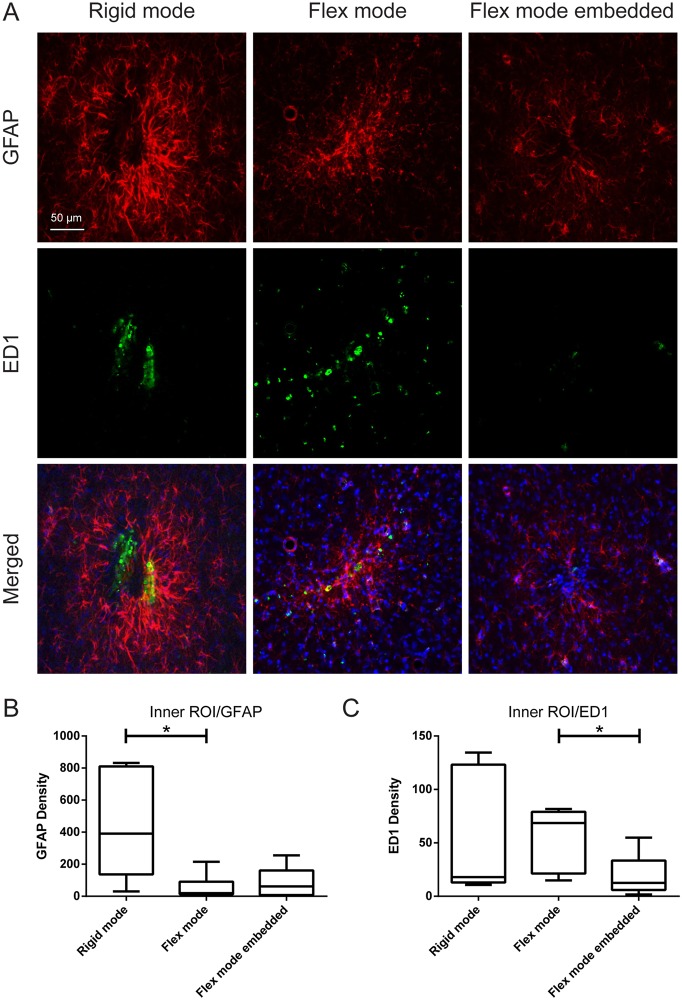
Fig 2. Implantation mode and embedding dependent glial reactions.
A) Representative images of rigid, flex and flex embedded mode implantations after 6 weeks, showing mode dependent alterations in astrocytosis, as shown in red (GFAP), microglia responses, as shown in green (ED1) and merged (DAPI in blue (total cell nuclei)). Scale bar: 50 μm. Cephalocaudal direction corresponds to top-to-bottom in image. B and C) Quantification of the GFAP and ED1 densities, respectively, that surrounds the different implantation sites in the inner ROI (0–50 μm). The box corresponds to the 25th and 75th percentiles, the median value is indicated by the horizontal line within each box, and the whiskers show the minimum and maximum values. The horizontal lines indicate statistical differences.

