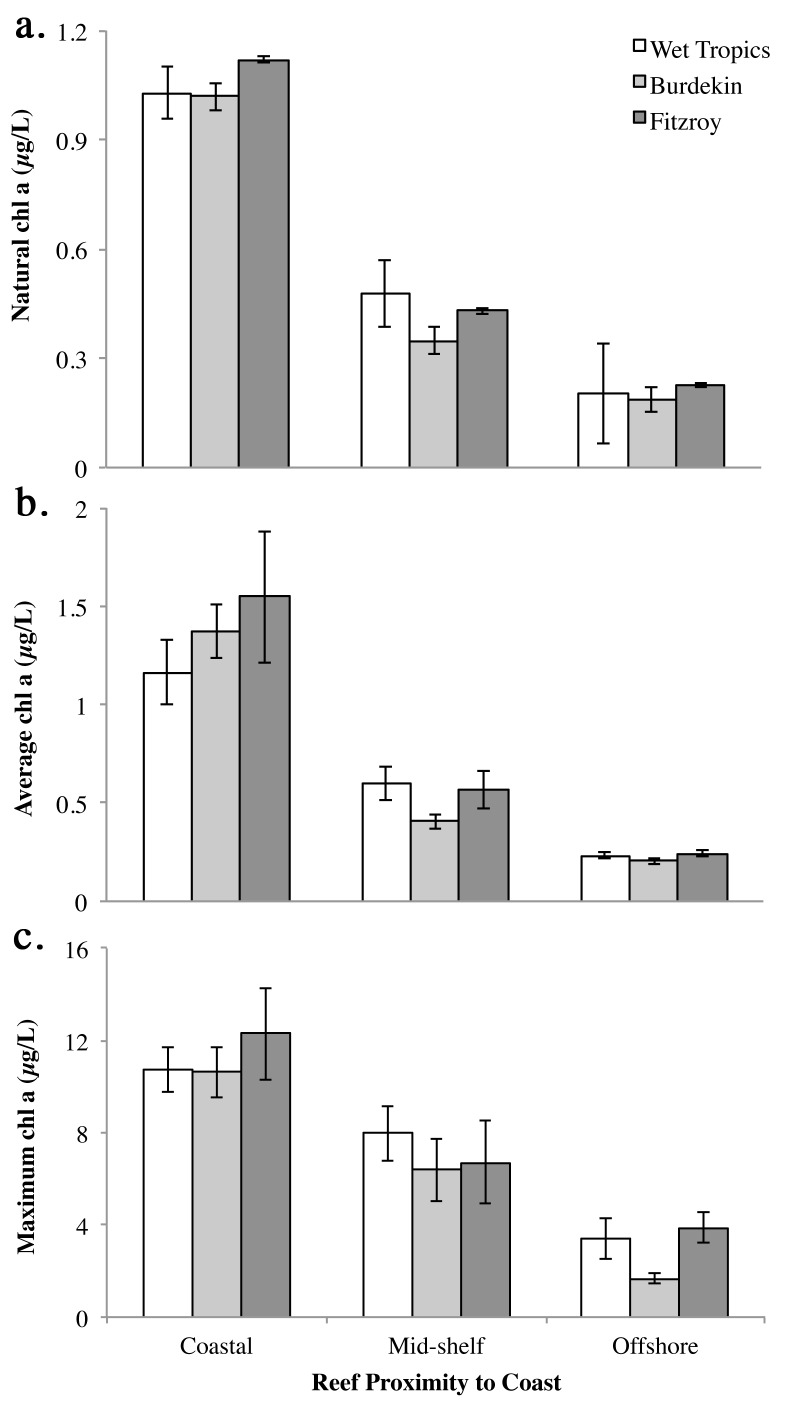
Fig 3. Levels of chl a (μg L-1) on the Great Barrier Reef where hotspots of Acanthaster planci outbreaks occur (Wet Tropics, Burdekin and Fitzroy), when larvae would be expected in the plankton (November-March).
Average (a) natural chl a from 2011–2014 (n = 20; ±se), and (b) mean and (c) maximum chl a recorded for the week following major cyclone or flood events between 2009–2014 (n = 7; ±se). Data sourced from eReefs (http://www.bom.gov.au/marinewaterquality/).

