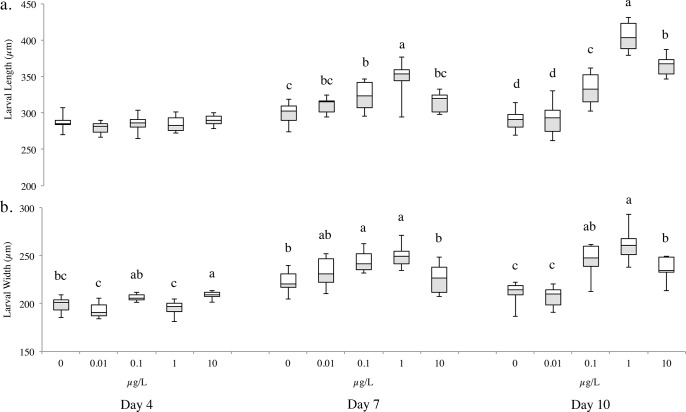
Fig 4. Larval (a) length and (b) width for Acanthaster planci reared in five algal concentrations, represented as chl a concentration (μg L-1) on days 4, 7 and 10 (n = 10).
Boxes represent the interquartile range (25 and 75th percentile), the horizontal line is the median, and the whiskers represent the data range. Tukey’s HSD test: levels not connected by the same letter are significantly different (within each day).

