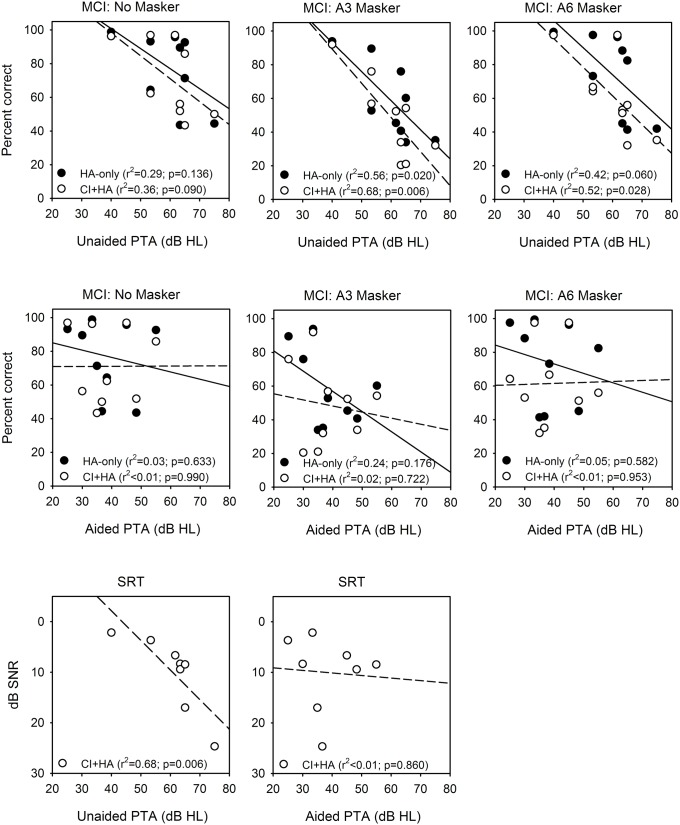
Fig 7. Scatter plots of music and speech performance versus unaided and aided thresholds in the non-implanted ear.
The top row shows MCI performance for the No Masker (left), A3 Masker (middle), and A6 Masker conditions (right), as a function of unaided PTAs at 125 Hz, 250 Hz, and 500 Hz. The solid circles show data for the HA-only condition; the solid line shows the linear regression (r2 and p-values are shown in the legend in each panel). The open circles show data for the CI+HA condition; the dashed line shows the linear regression. The middle row shows similar plots, but as a function of aided PTAs at 125 Hz, 250 Hz, and 500 Hz. The bottom row shows SRTs as a function of unaided PTAs (left) or aided PTAs (middle). Only CI+HA SRT data is shown.

