
Fig 5. Relative abundance of proteins tagged by biotin ligase fusion proteins identified by mass spectrometry.
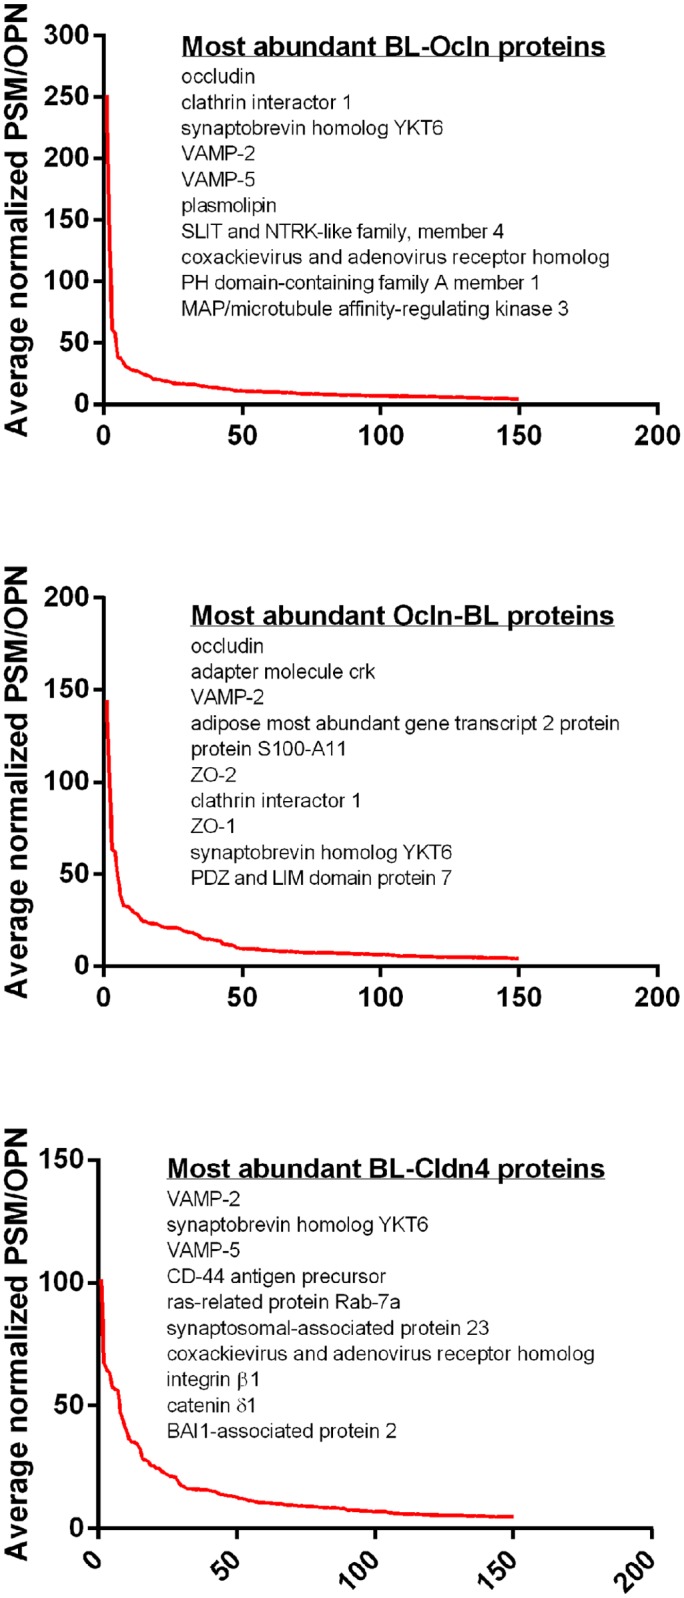
The y-axis is proportional to the amount of protein recovered and was calculated as follows: PSMs from each of the three isolations were normalized (PSM for each protein/total PSMs for that isolation), these normalized PSMs were averaged between the three runs and then divided by the number of theoretical observable peptide number falling in the size range detectable by MS and this value multiplied by 1000. Proteins were ordered by this value (largest to smallest); points on the x-axis indicate individual unique proteins identified using the Canis lupus familiaris Ref Seq database. Plotted are the top 150 enriched (three-fold or above biotin ligase alone levels) proteins for each fusion-protein. The top 10 most enriched proteins for each fusion protein are listed.