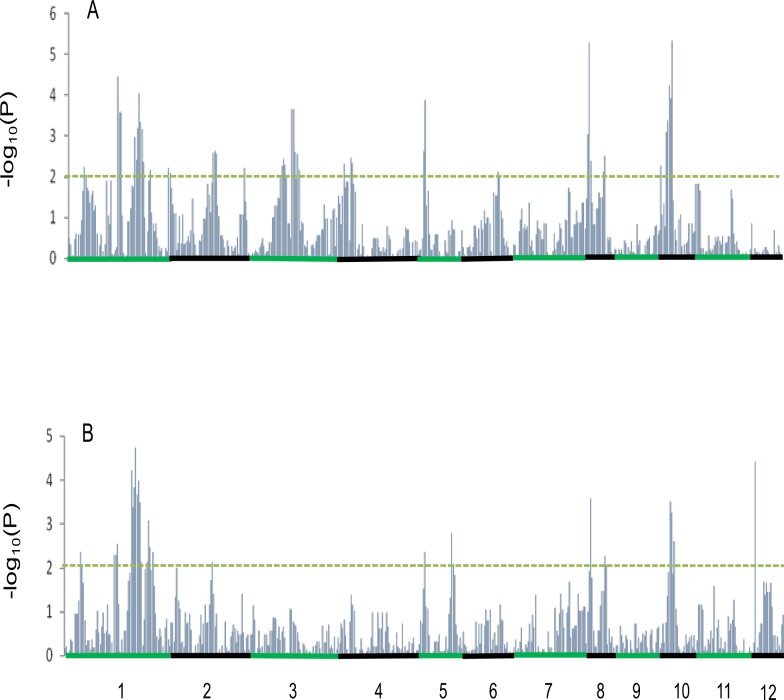
Fig 2. Bin mapping of grain chalkiness QTLs.
The bin effects on PGC (a) and DEC (b) along the whole genome in the NIP/ZS97 CSSL population. The green and black bars on the x-axis represent the chromosomes. The -log scale of P values are plotted on the y-axis. The dotted lines indicate the threshold with P = 0.01.

