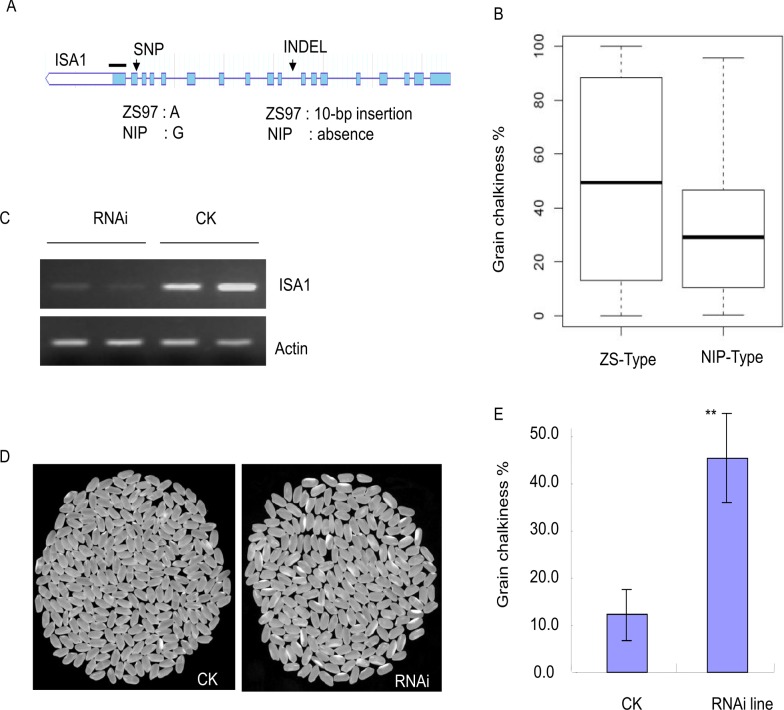
Fig 4. Suppression of ISA1 causes chalky grains.
(a) The gene ISA1 model showing INDEL and SNP differences between ZS97 and NIP; the exons (rectangles) and introns (lines connecting the exons) are illustrated; the RNAi target domain is indicated by a short bold line above the model. (b) Box plot for PGC levels of 31 NIP type and 73 ZS type varieties at the InDel (the middle line indicates the median, the box indicates the range of the 25th to 75th percentiles of the total data, the whiskers indicate the interquartile range). (c) Quantitative RT-PCR showing the repressed ISA1 expression in the RNAi line, where the Actin gene was used as an internal control. The (d) grain appearances and (e) PGC difference in the ISA1-RNAi line and the control. Asterisks (**) indicate mean values are significantly different at P < 0.01.

