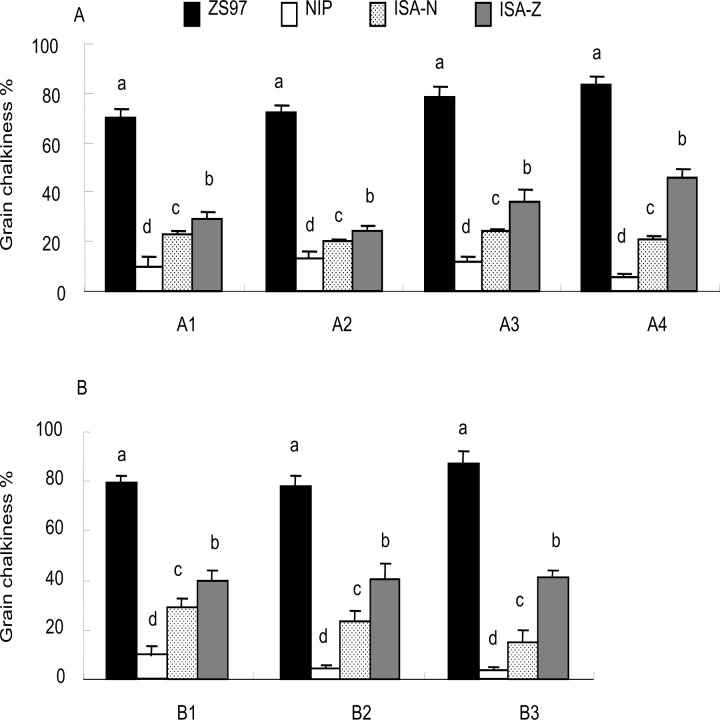
Fig 6. Evaluation of the NILs with contrasting ISA1 alleles.
(a) The trial with four sowing dates (A1–A4) in 2010. (b) The trial with three sowing dates (B1–B3) in 2011. ISA-N and ISA-Z represent the ISA1 alleles from NIP and ZS97, respectively. Different letters (a, b, c, and d) above the bars indicate significant differences at P < 0.01 using Duncan’s test.

