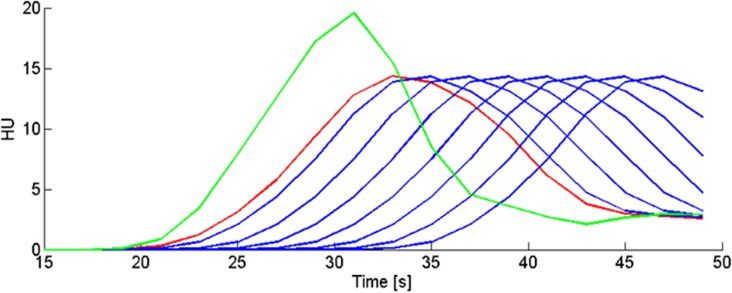
Fig 1. Tissue TACs of the hypoperfused and healthy tissue in the phantom data.

In green is the TAC of the healthy tissue. In red is the TAC of the hypoperfused tissue without arrival delay of contrast agent (the original phantom data). The blue curves are the shifted TACs of the hypoperfused tissue of each individual phantom (n = 7). Each curve has a different amount of time shift (from left to right:1, 3, 5, 7, 9, 11 and 13 seconds), and thus arrival delay of contrast agent, relative to the TAC of the healthy tissue (green). With increasing time shift the proportion of the TAC that is truncated increases.
