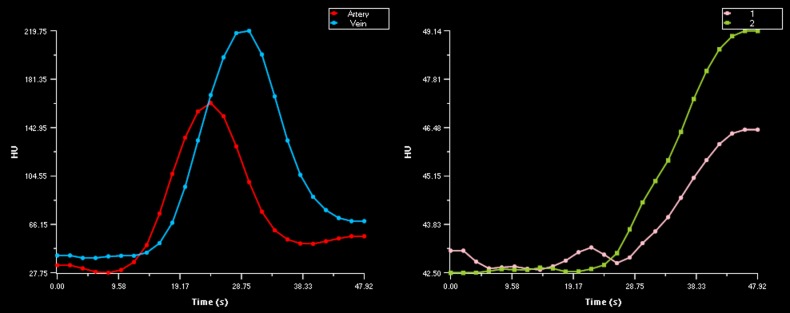
Fig 2. Examples of tissue time attenuation curve truncation with normal AIF and VOF.

Normal AIF and VOF for the CTP data of patient 19 (left) and corresponding truncated tissue TAC for the 48 seconds acquisition data of the same patient (right). These figures illustrates that an acquisition time of 48 seconds can be insufficient to capture the complete outwash of contrast agent from the ischemic tissue.
