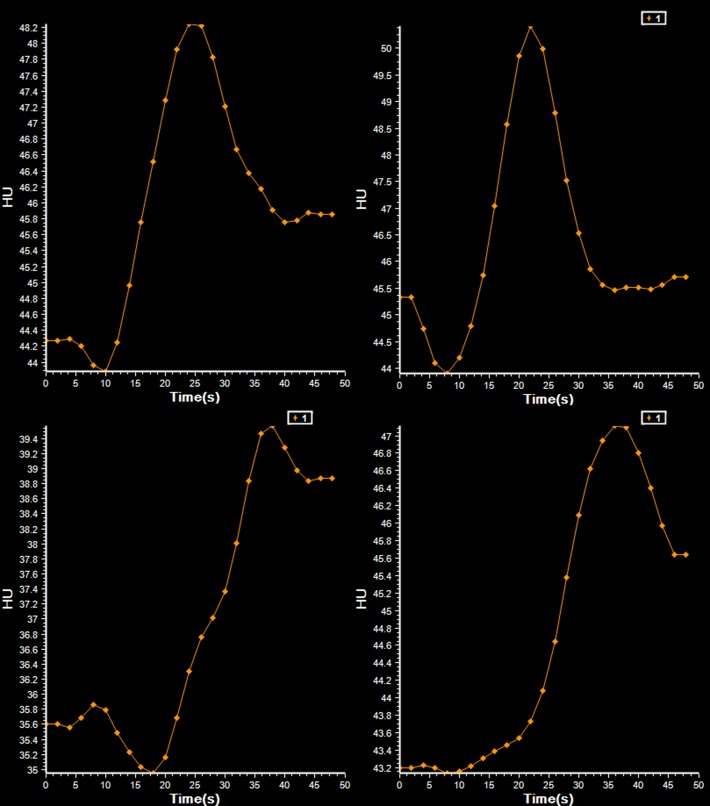
Fig 4. Examples of complete and incomplete tissue time attenuation curves.
Complete tissue time attenuation curves from patient 6 (upper left) and patient 24 (upper right). Truncated tissue time attenuation curve from patient 7 (bottom left) and 3 (bottom right). The AIF and VOF of patients 7 and 3 were complete.

