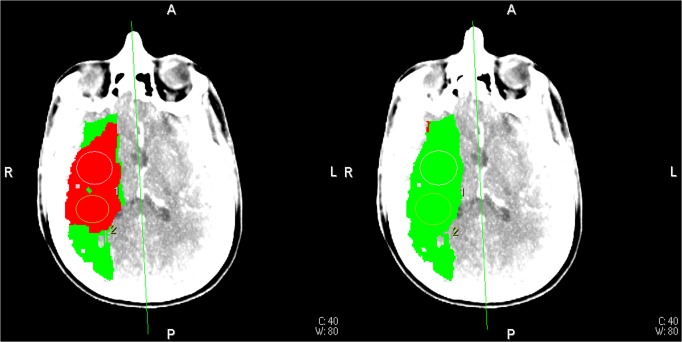
Fig 7. CTP summary maps from patient 19.
CTP summary map for the 48 seconds acquisition data with truncated tissue TAC (left). Corresponding CTP summary map for the 210 seconds acquisition data with complete TACs (right). Red: ischemic core, green: ischemic penumbra (See Fig. 2 for corresponding TAC curves).

