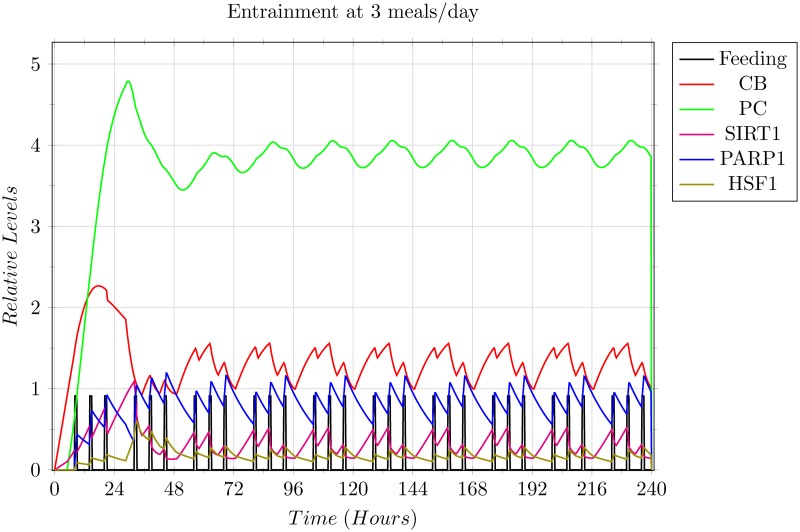
Fig 8. Simulation results of the 3 meals/day entrainment base scenario.
Each grid box shows 1 complete day on the x-axis, and a complete level on the y-axis. The graph shows the oscillations of the entities in accordance with the 0800 hrs breakfast, 1400 hrs lunch, and 2000 hrs dinner, with an overnight fast of 12 hours, for a duration of 10 days. The entities were able to entrain on the third day, and continued the periodic behaviour from then on. All entities are utilising their respective rate values given in Table 2, except for the Feeding signal which is modelled as a periodic discrete signal, shown as the vertical black pillars. The number of meals, and their timings was assumed to be the prevalent regimen, and were thus used as the base scenario to model other differing regimen scenarios.

