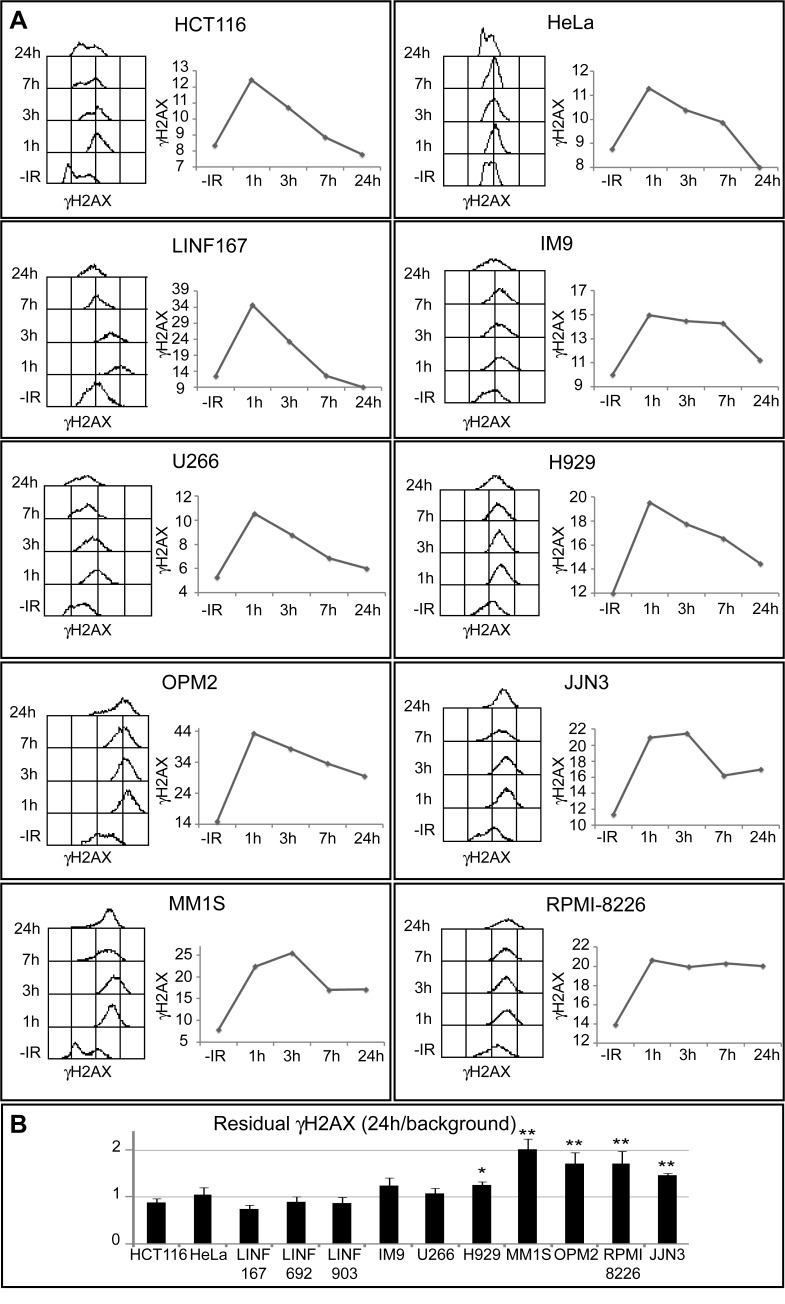
Fig 1. Kinetics of γH2AX loss following IR.
(A) Asynchronous cells were treated with 2 Gy IR, fixed at the indicated times post-irradiation, and stained with anti- γH2AX and secondary fluorescent antibodies. Kinetics of γH2AX disappearance is illustrated for each cell line by a histogram, showing the levels of γH2AX at different times post-IR, and a graphic, where the mean intensity of γH2AX (in arbitrary units) is plotted. Best representative from several independent experiments is shown. Similar results were obtained for all LINF cell lines (only LINF167 is shown). (B) Residual γH2AX, quantified as the ratio of the signal at 24h post-IR/signal in non-irradiated cells, was obtained as the mean of three independent experiments. Error bars correspond to standard deviation (SD) (** p<0.01, * p<0.05, compared to LINF cells, Student's t-test).

