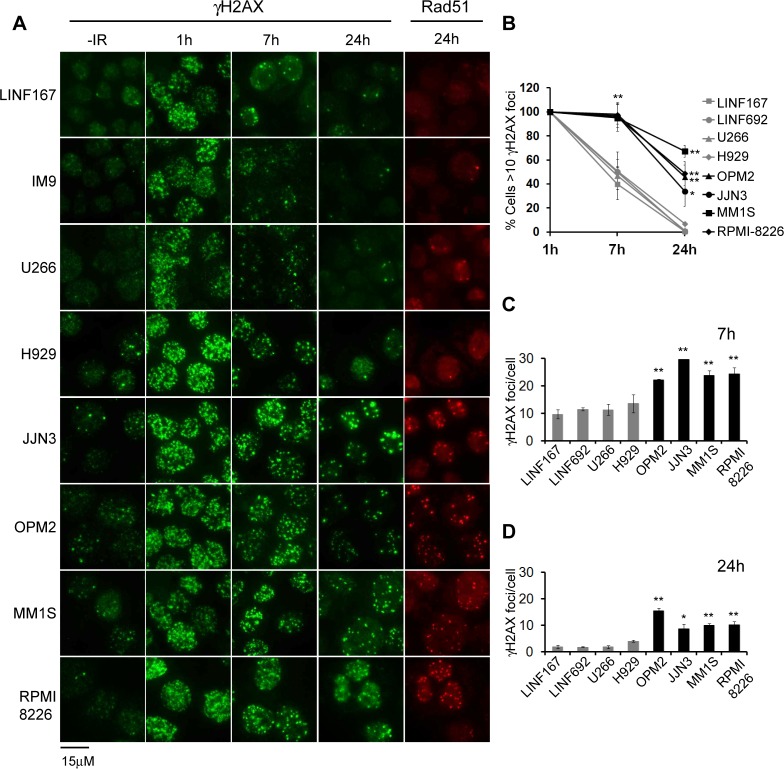
Fig 2. γH2AX foci after exposure to IR (2 Gy).
(A) Representative images of γH2AX foci in untreated cells, and in cells irradiated with 2 Gy 1h, 7h and 24h post-IR. Rad51 foci in cells at 24h post-IR are also shown. (B) Percentage of cells with γH2AX foci at the indicated times post-IR. (C) and (D) Quantification of the number of γH2AX foci per cell at 7 and 24h post-IR. In all quantifications data represent the mean values of at least 2 independent experiments. (** p<0.01, * p<0.05, compared to LINF cells). A minimum of 100 cells per experiment and cell line were counted.

