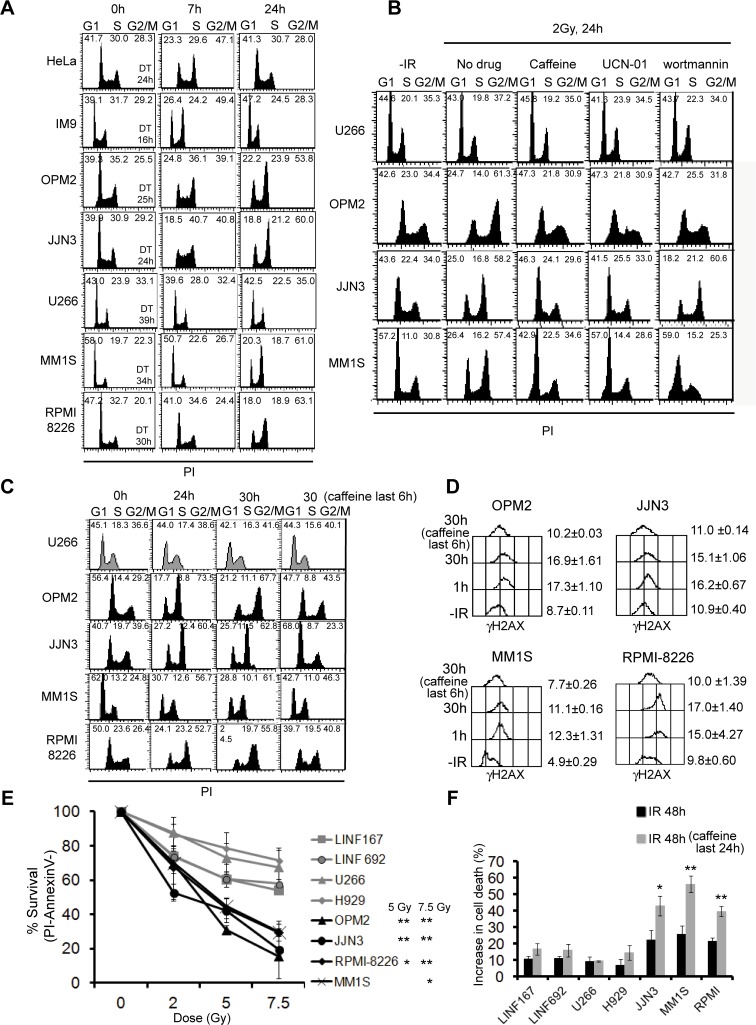
Fig 4. Cell cycle phase distribution and cell survival after exposure to IR.
(A) Cell cycle analysis. Cells were fixed at the indicated times post-IR and DNA content was measured by flow cytometry. Percentages of cells in the different phases of the cell cycle are indicated and duplication times (DT) were calculated (http://www.doubling-time.com/compute.php). Best representative from several independent experiments is shown. (B) Cell cycle distribution of cells at the indicated times post-IR (2 Gy) in the presence or in the absence of the checkpoint inhibitors (caffeine, UCN-01 and wortmannin). (C) Caffeine (4 mM) was added 24h post-IR and maintained for 6h. (D) Levels of γH2AX (in arbitrary units) in the absence of treatment (-IR), 1h, 30h post-IR and 30h post-IR with the last 6h in the presence of caffeine. Data are the mean of two independent experiments. (E) Cells were irradiated with the indicated doses of IR and 72h later cell viability was evaluated by annexinV/PI staining. Data are the mean ± SD of three independent experiments (** p<0.01, * p<0.05 in OPM2, JJN3, RPMI-8226 and MM1S compared to LINF cells). (F) Increase in the percentage of cell death compared to untreated samples after the indicated treatments. Asterisks in samples treated with caffeine indicate significant values related to irradiated cells (** p<0.01, * p<0.05).

