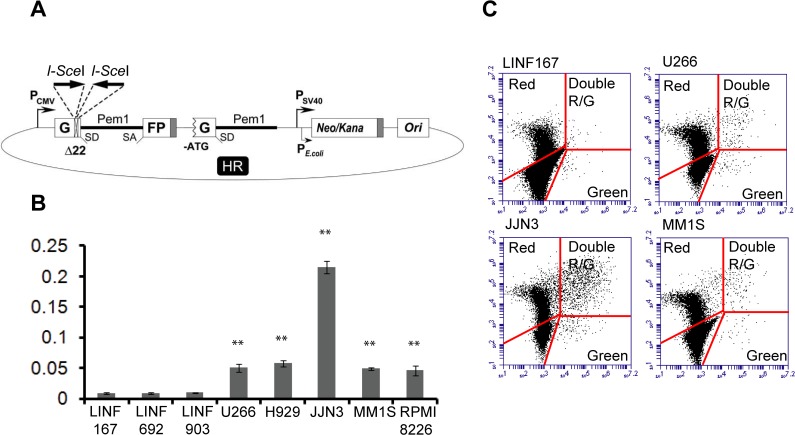
Fig 7. Analysis of HR in normal LINF and MM cell lines.
(A) Reporter plasmid for detection of HR [22]. (B) Cells were transfected with 2 μg of SceI-digested HR plasmid together with 2 μg of pDSRed2-N1 to normalize for the differences in transfection efficiency. Numbers of green and red cells were determined 48h after transfection by FACS. The ratio of GFP+ cells to DsRed+ cells was used as a measure of repair efficiency. Data are means ± SD of three independent experiments. (C) Representative images showing dot plots corresponding to the indicated cell lines. A total of 6,000 GFP+ and/or DsRed+ cells are shown. (** p<0.01, compared to LINF cells).

