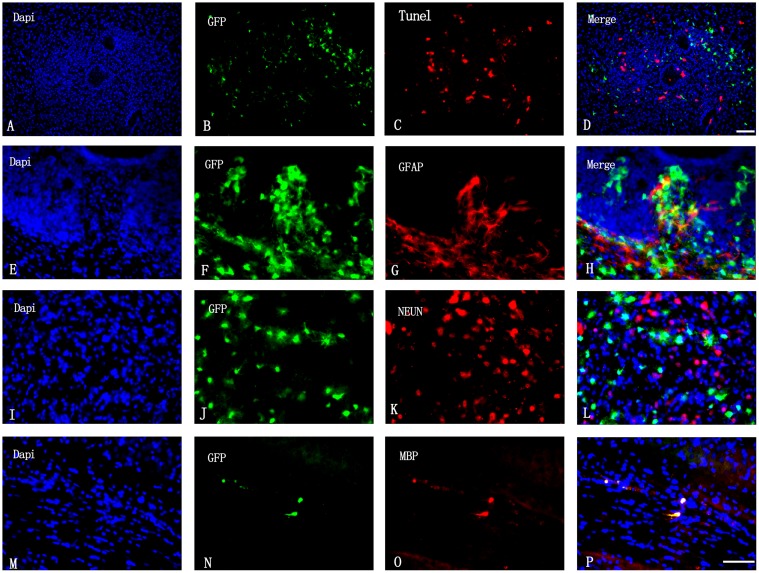
Fig 1. Survival and differentiation of transplanted OPCs.
(A–D) Apoptosis of OPCs was analyzed labeling cells with DAPI (blue), GFP (green), and by the TUNEL reaction (red). Scale bar = 50 μm. (E–H) OPC differentiation into astrocytes was visualized by DAPI staining (blue) and GFP (green) and GFAP (red) immunolabeling. (I–L) OPC differentiation into neurons was visualized by DAPI staining (blue) and GFP (green) and NeuN (red) immunolabeling. (M–P) Myelin sheath formed by GFP+ OPCs was visualized by DAPI staining (blue), and GFP (green) and MBP (red) immunolabeling. Scale bar = 20 μm (E–P).

