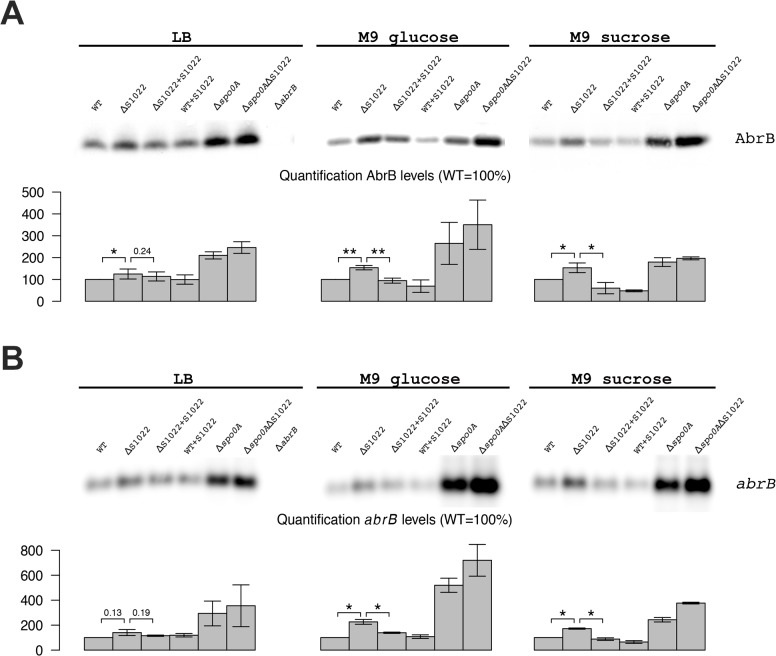
Fig 2. AbrB levels are dependent on the presence of RnaC/S1022.
A) AbrB Western blot analysis. The position of AbrB is indicated. The bar diagrams show the relative AbrB levels, with the level in the parental strain (wt) set at 100%. All AbrB levels were corrected for the internal control protein BdbD. Error bars represent the standard deviation between triplicate experiments. The effect of RnaC/S1022 absence is most pronounced in cells grown on M9G and M9S, which corresponds to higher expression levels under these growth conditions. Statistical data analyis was performed with a one-sided Welch two-sample t-test (H1: AbrB/abrB levels in ΔRnaC/S1022 > than in the parental strain and the RnaC/S1022 complementation strain). The respective p-values are either indicated, or marked with asterisks (* p-value <0.05; ** p-value <0.01). B) abrB Northern blot analysis. Equal amounts of RNA were loaded in each lane. The bar diagrams show the relative abrB mRNA levels, with the level in the parental strain (wt) set at 100%. Quantifications are based on minimally two independent experiments. Error bars represent the standard deviation between experiments. Data was analyzed for significance as in A.

