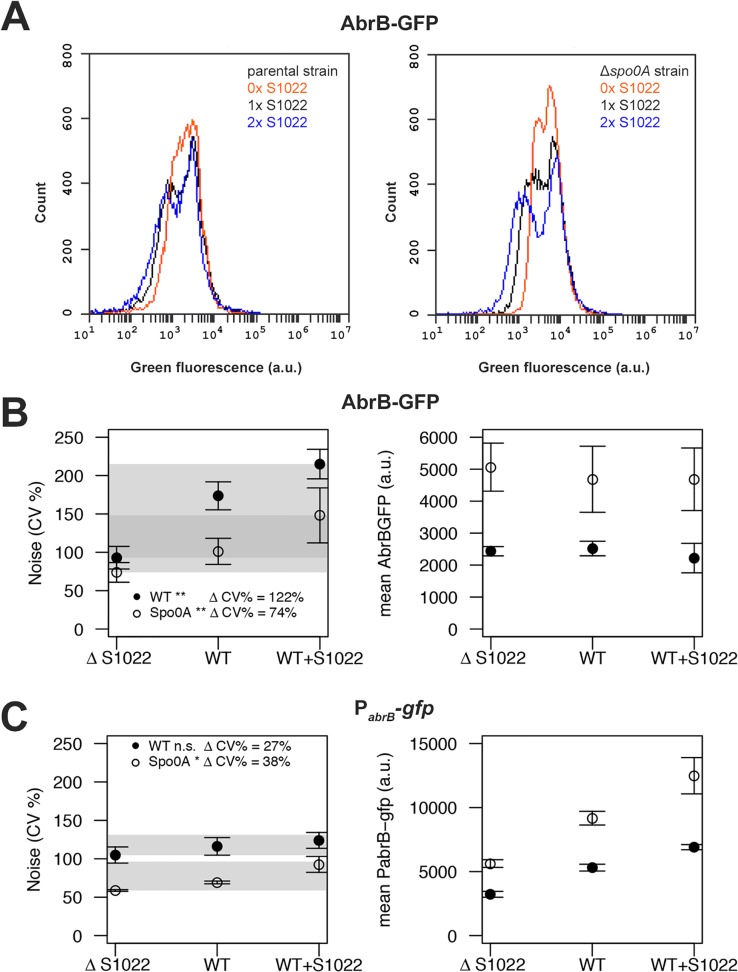
Fig 5. RnaC/S1022 induces protein expression noise of AbrB-GFP.
A) Representative FC data for the translational AbrB-GFP fusion expressed from a single copy of the respective gene fusion integrated into the B. subtilis chromosome. All strains were grown on M9G. The left panel shows histograms for, from left to right, the AbrB-GFP-producing strain with two chromosomal RnaC/S1022 copies, the AbrB-GFP-producing parental strain with one chromosomal RnaC/S1022 copy, and the AbrB-GFP-producing strain with the ΔRnaC/S1022 mutation. The right panel shows data for the same strains with an additional Δspo0A mutation. Please note the increase in the width of the distribution with increasing RnaC/S1022 gene dosage. B) Quantification of AbrB-GFP noise (left panel) and mean expression data (right panel) from three independent experiments with cells grown on M9G. Shaded areas indicate the noise increase (ΔCV%) from 0 to 2 sRNA copies in the spo0A-proficient background (wt) and the Δspo0A mutant background. Statistical significance of the comparisons of data obtained for spo0A-proficient or -deficient strains containing 0 to 2 sRNA copies are indicated with asterisks in the legend (* p-value <0.05; ** p-value <0.01; ANOVA with Tukey HSD test). Error bars represent the standard deviation. C) Quantification of PabrB-gfp noise (left panel) and mean PabrB-gfp activity data (right panel) from three independent experiments with cells grown on M9G. Statistical significance of the comparisons of data obtained for spo0A-proficient or -deficient strains containing 0 to 2 sRNA copies are indicated with asterisks in the legend (* p-value <0.05; n.s. means not significant; ANOVA with Tukey HSD test). Error bars represent the standard deviation.

