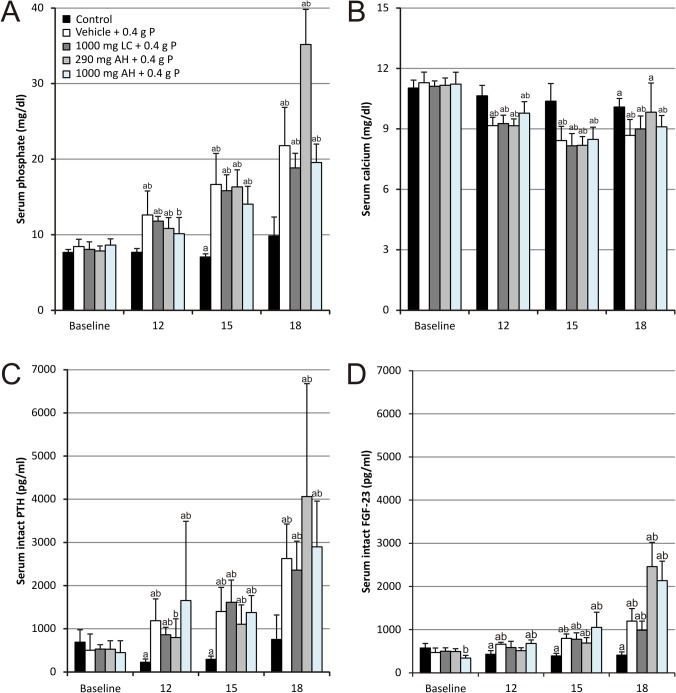
Fig 1. Serum (A) phosphate, (B) calcium, (C) intact PTH and (D) intact FGF-23 levels.
Data are presented as mean ± standard deviation. (a P<0.05 vs baseline; b P<0.05 vs control) (12: 12 hours after the first OSP dose; 15: 3 hours after the second OSP dose and 18: 6 hours after the second OSP dose; n = 6 per group; statistical tests: Mann–Whitney-U and Wilcoxon-signed-rank).

