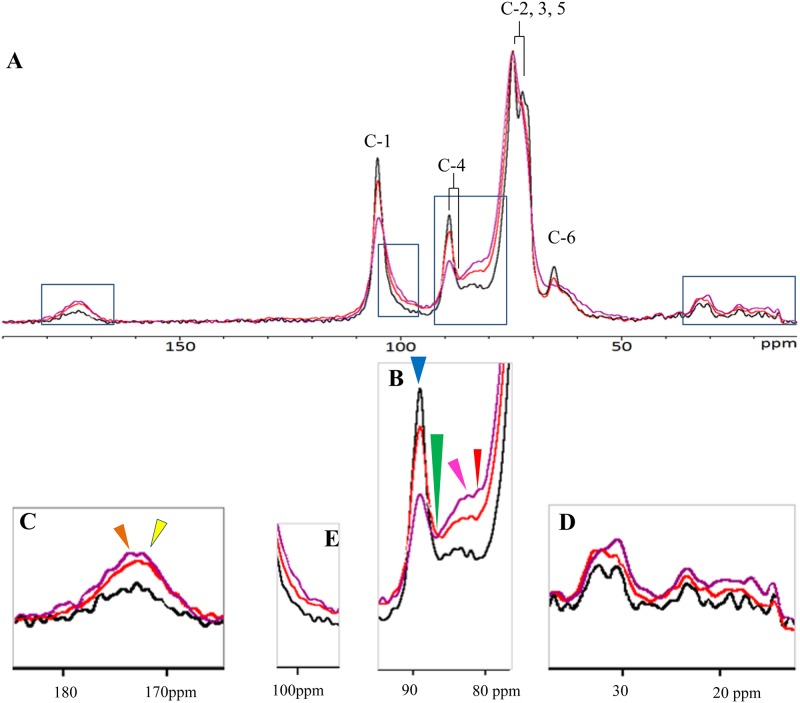
Fig 3. 13C NMR spectra of cellulose pellicles produced by mutant I-23 (red), mutant #52 (purple), and wild type (black).
(A) Full spectra with carbon-1 to carbon-6 of glucose in crystalline cellulose indicated. (B) The region of the spectra showing the peak area of carbon-4 of glucose in crystalline cellulose (88.9 ppm), indicated by a blue arrow; peak area of carbon-4 of glucose in non-crystalline cellulose (85.0 ppm), indicated by a green arrow; peak areas of 82.0 ppm, indicated by a red arrow, and 83.0 ppm, indicated by a pink arrow, assigned to carbons of monosaccharides in non-cellulosic polysaccharides. (C) The region of the spectra showing the peak areas of 172.8 ppm, indicated by a yellow arrow, and 176.3 ppm peak, indicated by an orange arrow, assigned to ester or acid carboxyl carbons of monosaccharides in non-cellulosic polysaccharides. (D) The region of the spectra showing peaks assigned to methyl groups at ~20 ppm. (E) The region of the spectra showing carbon-1 of monosaccharides in non-cellulosic polysaccharides.

