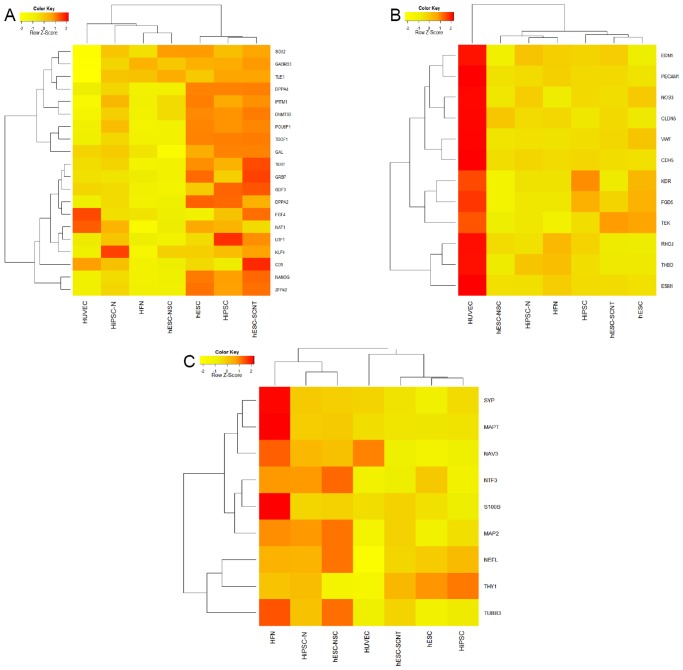
Fig 5. Microarray-based gene analysis.
The graphs show cluster analysis of Row Z-score data of (A) pluripotent/embryonic, (B) endothelial, as well as (C) neuronal and glial genes expressed by HUVECs, HiPSCs, HiPSC-derived neurons (HiPSC-Ns), HFNs and samples obtained from previous publications as described in the Materials and Methods (hESCs, hESC-NSCs, hESC-SCNTs). Data are average values of 3 independent experiments.

