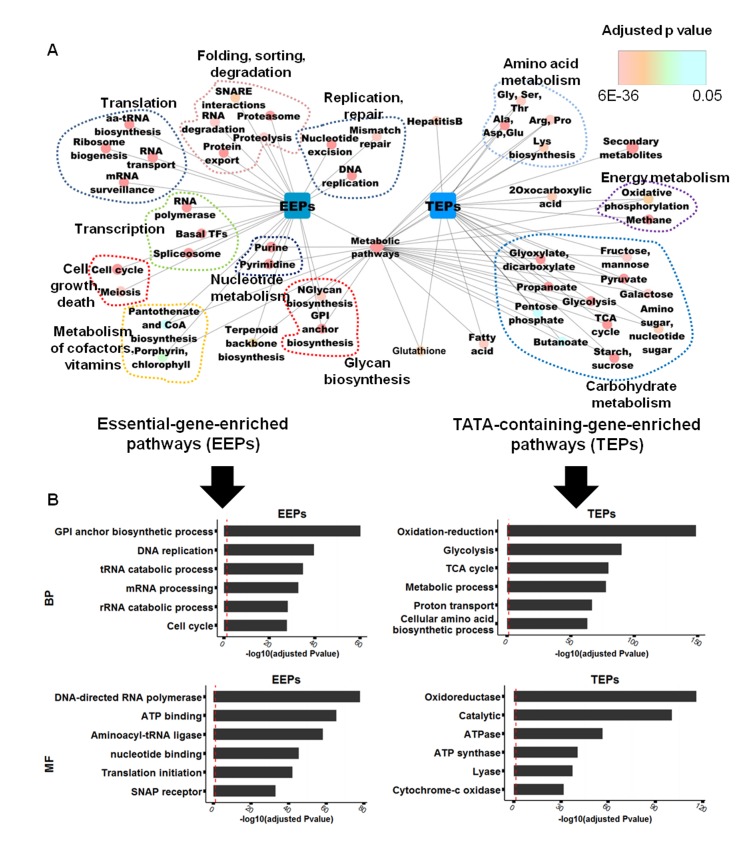
Fig 1. Classification of KEGG pathways into essential-gene-enriched pathways (EEPs) and TATA-containing-gene-enriched pathways (TEPs).
(a) We created a network to show which KEGG pathway (ellipse node) belongs to EEPs or TEPs (round rectangle nodes) and which one is included in metabolic pathways (diamond node in the center). The relations are described as edges between two nodes; for instance, glycolysis belongs to TEPs and metabolic pathways. Color (upper-right) represents an adjusted p-value in enrichment analysis. (b) The bar graph shows the results of GO (gene ontology) enrichment analysis in EEPs and TEPs. The red dashed lines correspond to the log transformation of an adjusted p-value of 0.05. BP, biological process; MF, molecular function.

