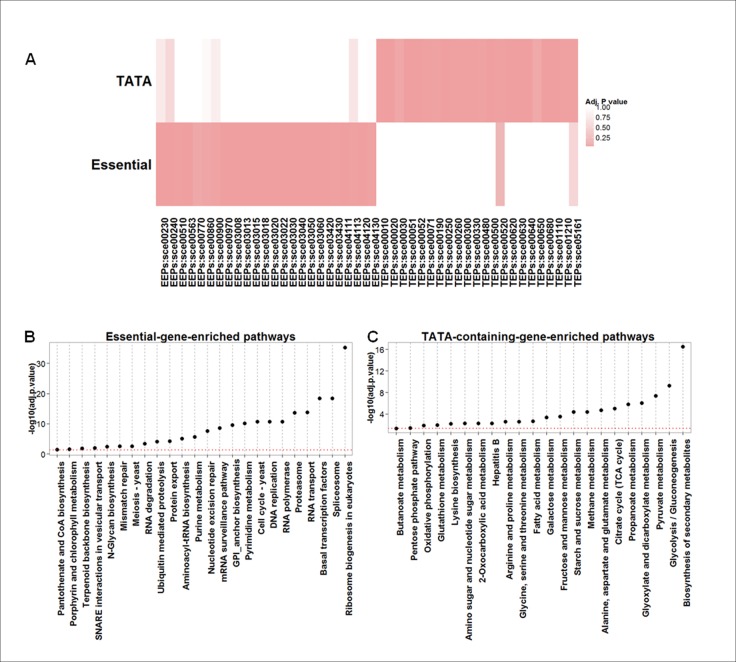
Fig 2. Marked differences in genes and pathways between EEPs and TEPs.
(a) The heat map of the adjusted p-values obtained from the enrichment test showed that EEPs are obviously different from TEPs. Rows represent genes and columns pathways (pathway ID); colors represent the negative log transformation of the adjusted p-values, showing the extent to which essential and TATA genes are enriched in the corresponding pathways. (b) Essential-gene-enriched pathways (EEPs) and (c) TATA-containing-gene-enriched pathways (TEPs). The enriched pathways were sorted according to the negative log of the adjusted p-value. The red dashed lines correspond to the log transformation of an adjusted p-value of 0.05.

