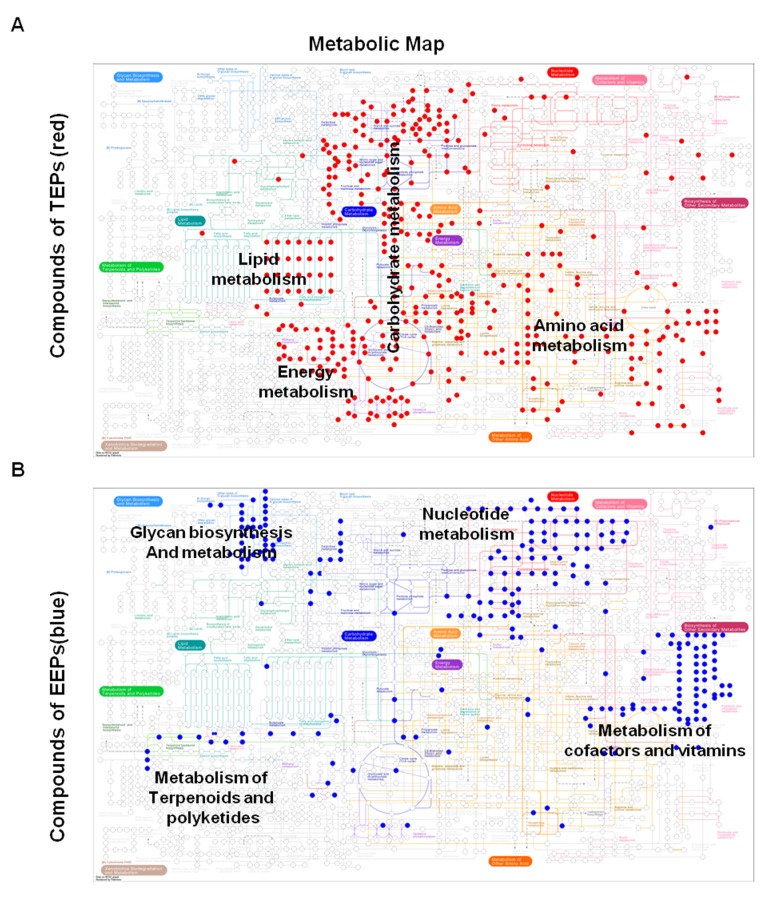
Fig 5. Comparison of pathways in TEPs and EEPs on metabolic map.
(a) TEPs and (b) EEPs are associated with different modules in the metabolic pathways analysis; these are highlighted in color (red for TEPs and blue for EEPs). Most of the TEPs in the metabolic pathways are associated with carbohydrate metabolism. Circles indicate compounds in the metabolic pathways.

