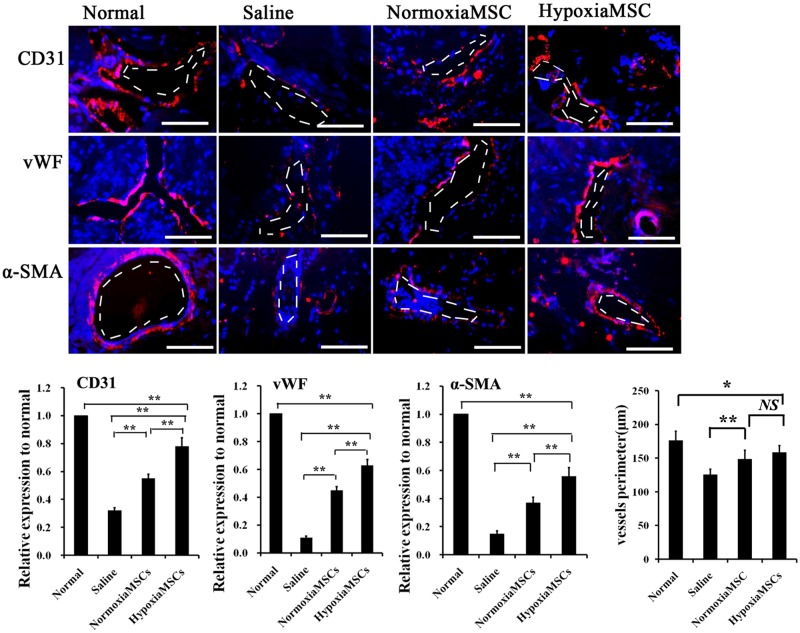
Fig 7. Expression of vascular markers in rats receiving different treatment.
Top panel: representative images of CD31, vWF and α-SMA-positive AMSCs (red) in corpus cavernosum of normal control rats (left) and diabetes induced ED rats receiving intracavernous injection with saline (middle left), N-AMSCs (middle right) and H-AMSCs (right). Bottom panel: Ratio of CD31, vWF and α-SMA identified in corpus cavernosum expressed as relative expression to the normal controls. The average vessels perimeter (μm) was calculated by ImagePro software. The saline treated group was significantly but not markedly shorter in length than the AMSCs treated groups, while no significant differentiation was observed between N-AMSCs and H-AMSCs treated group, possibly suggesting limited promotion of structure recovery of vessels. Immunofluorescent staining analysis of cavernous tissue using CD31, vWF and α-SMA antibodies in normal control and saline or N-AMSCs or H-AMSCs treated diabetic rats. Plenty of positive stained cells by CD31, vWF and α-SMA around vessel in the Normal group indicated sound vascular structure. A significant decrease of positive stained cells by CD31, vWF and α-SMA around vessel in the ED induced group (saline group) were observed, suggesting a serious cell damage in vascular structure. When diabetes induced ED rats treated by NMSCs or HMSCs, vascular structure restored to a degree and the HMSCs group had better effects than NMSCs. DAPI staining and vessel: dash line; Scale bar: 50um, *P<0.05, **P<0.01, NS P>0.05.

