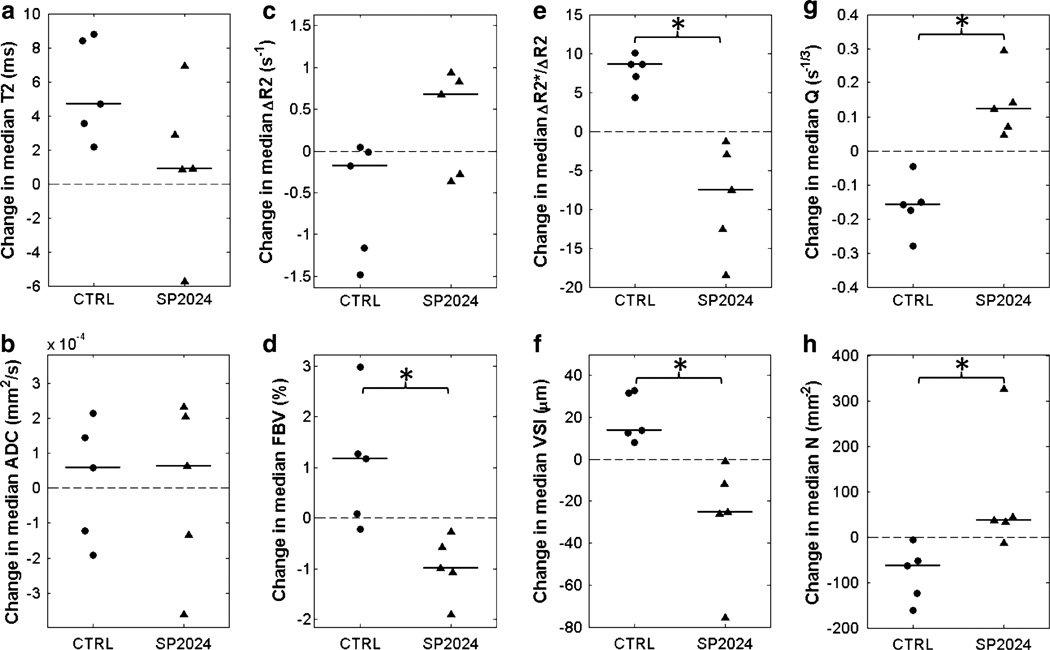
Fig. 4.
Dot plots of changes in tumor-wise median MRI biomarker values from day 0 to day 14 for control (CTRL) and treated (SP2024) tumors. Horizontal lines indicate group medians. There was no significant difference between control and treatment groups in the changes in T2 (a) and ADC (b). With the exception of ΔR2 (c), there was a significant difference in the changes in all of the vascular biomarkers (d–h). * p < 0.05, two-tailed Mann–Whitney U test

