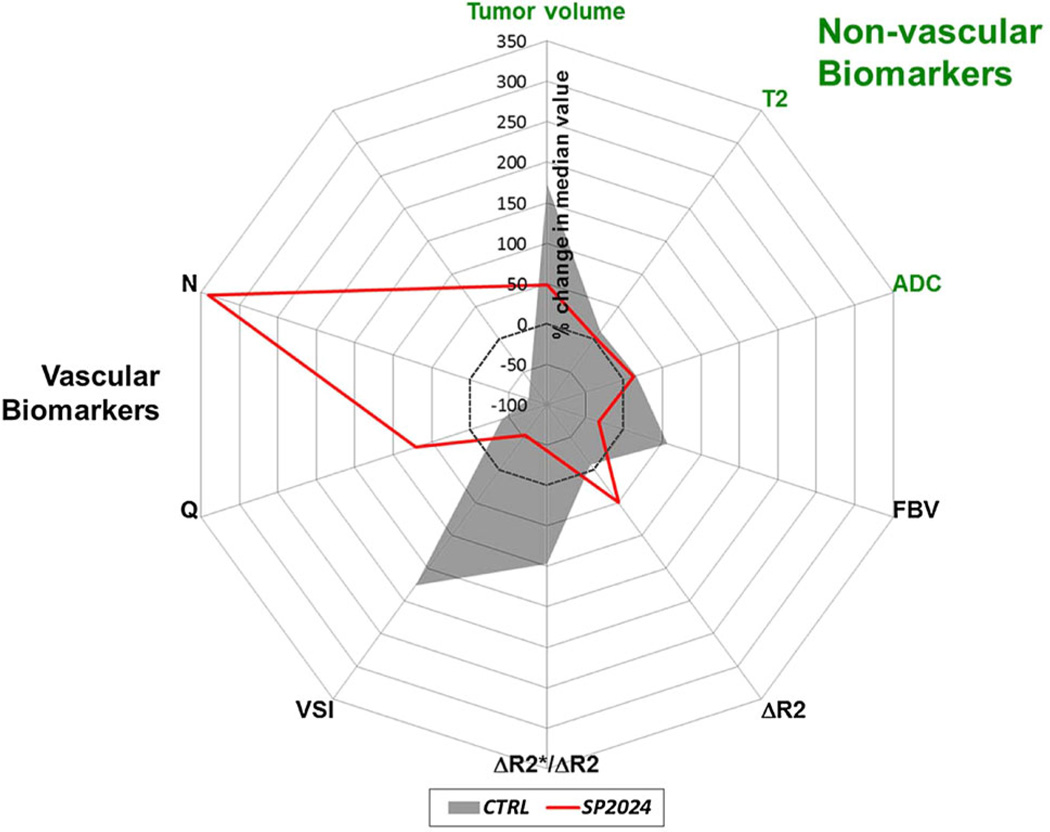
Fig. 5.
Radar plot of the percent changes in the median values of non-vascular and vascular MRI biomarkers for control (gray fill) and SP2024-treated (red line) groups. This clearly illustrates the sensitivity of vasculature-specific MRI biomarkers to the anti-angiogenic effects of SP2024 relative to the non-vascular or conventional MRI biomarkers

