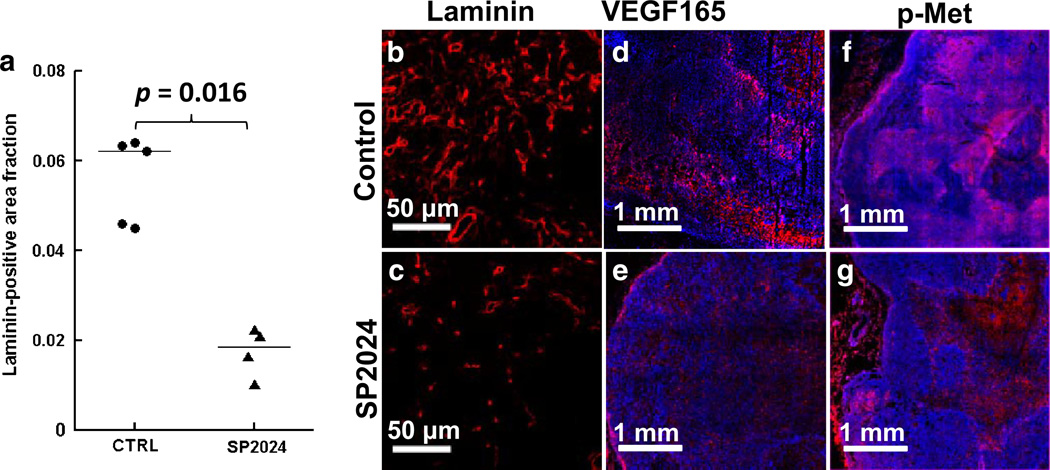
Fig. 7.
a Dot plot of tumor-wise average laminin-positive area fractions. Horizontal lines indicate the group medians. b, c 20× fluorescent images of representative laminin-stained sections from control and SP2024-treated tumors. d, e 10× fluorescent images of representative VEGF165-stained sections from control and treated tumors. f, g 10× fluorescent images of representative p-Met-stained sections from control and treated tumors

