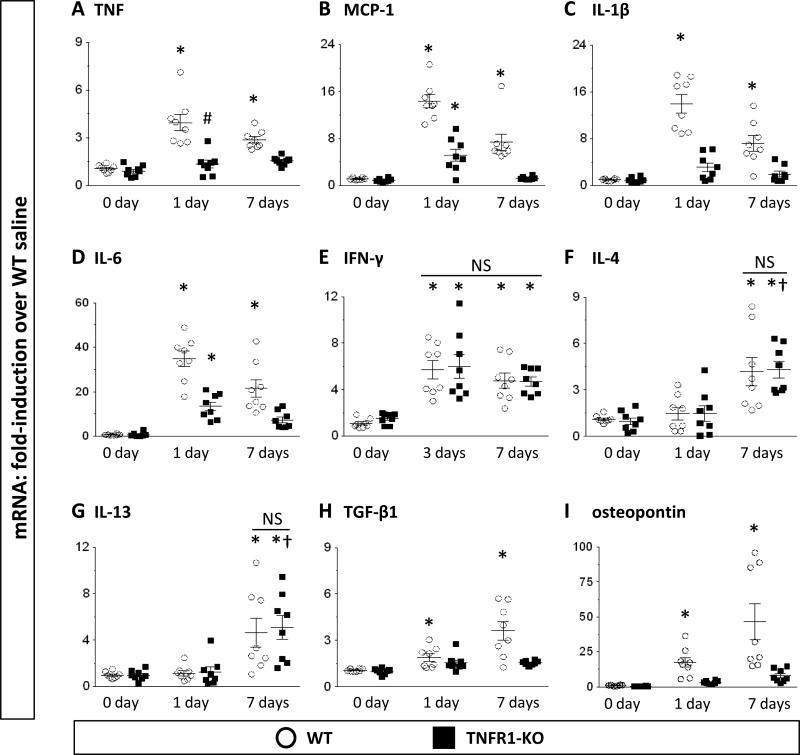
Figure 2. Transcriptional activation of inflammation- and fibrosis- related genes after Ang-II exposure.
Data are represented as fold-increase over WT saline (=1-fold). Data for IFN-γ is given at 3-day Ang-II-infusion (no increase at 1-day). Statistics: For all groups n=8. (*) indicates a statistically significant difference between saline-treated and 1(3)-day or 7-day Ang-II-infused mice and (†) between 1-day and 7-day Ang-II-infused mice within the same genetic background; (#) between WT and TNFR1-KO groups at the same time point (Kruskal-Wallis, Dunn's). NS: not significant.

