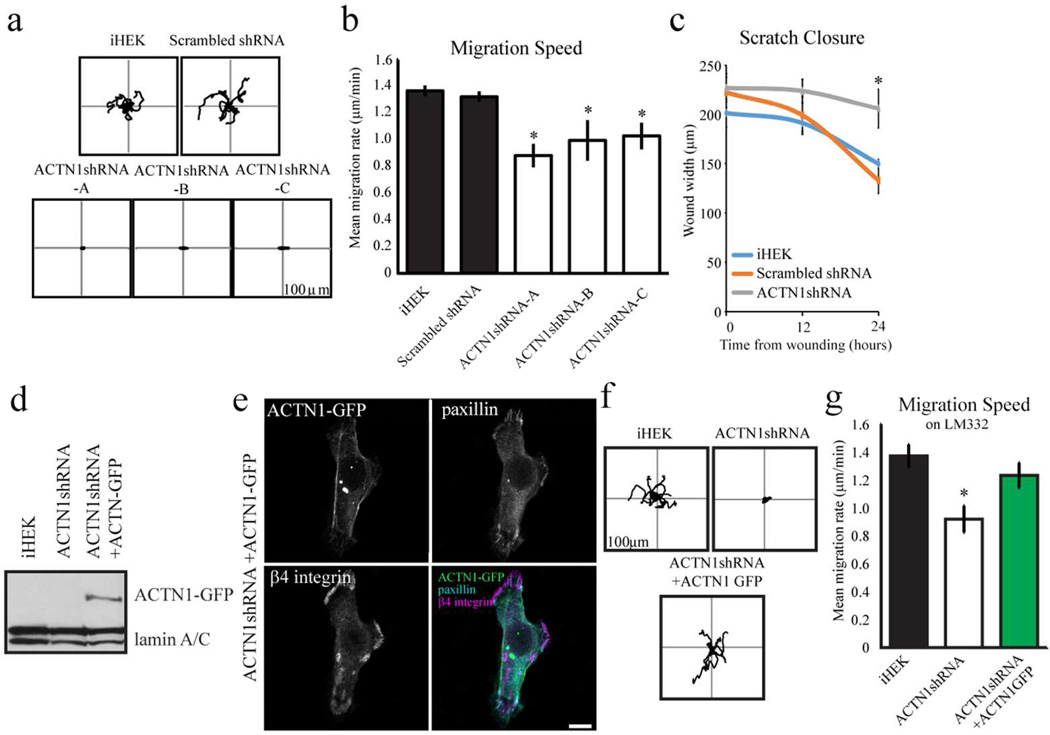
Figure 5. ACTN1 knockdown impacts cell motility.
(a) Representative rose diagrams depicting the motility behavior of iHEKs, iHEKs expressing scrambled shRNA and the three ACTN1 knockdown clones (ACTN1shRNA-A, -B and -C). The cells were viewed over a 1 hour period, 18–24 hours after plating onto uncoated substrates. In b, the migration speed of the cells in (a) is depicted graphically. * Denotes significant differences, p>0.05. (c) At time 0, linear scratchs were introduced into confluent monolayers of iHEKs, iHEKs expressing scrambled shRNA and one ACTN1 knockdown clone. The scratch width was measured at indicated points. * Denotes significant difference, p<0.05, from both iHEK and scrambled shRNA. In d, extracts of iHEKs, iHEKs expressing ACTN1 shRNA cells and the latter cells induced to express GFP-tagged actinin-1 mRNA refractory to ACTN1 shRNA were prepared for immunoblotting using antibodies against GFP and lamin A/C. The latter serve as a loading control. (e) iHEKs expressing ACTN1 shRNA and the GFPtagged ACTN1 as in c were viewed by confocal fluorescence microscopy using antibodies against paxillin and β4 integrin, in combination with direct visualization of GFP, as indicated. The panel in the lower right is an overlay of all three images. Bar, 10 µm. (f) Rose diagrams depicting the motility behavior of representative iHEKs, iHEKs expressing ACTN1 shRNA and the latter cells induced to express GFPtagged ACTN1 mRNA refractory to ACTN1 shRNA are shown. The cells were plated onto iHEK matrix and allowed to adhere for 6–10 hours prior to being assayed for 1 hour. (g) Migration speed of the cells as in e. The results of quantification of GFPpositive cells only are shown for the 'rescued' cells (ACTN1shRNA + ACTN1GFP) in e and f. * Denotes significant differences between ACTN1 shRNA expressing cells and both iHEK and iHEK expressing scrambled shRNA (b,c) or between ACTN1 shRNA expressing cells and the same cells induced to express the GFP-tagged ACTN1 mRNA (g), p<0.05.

