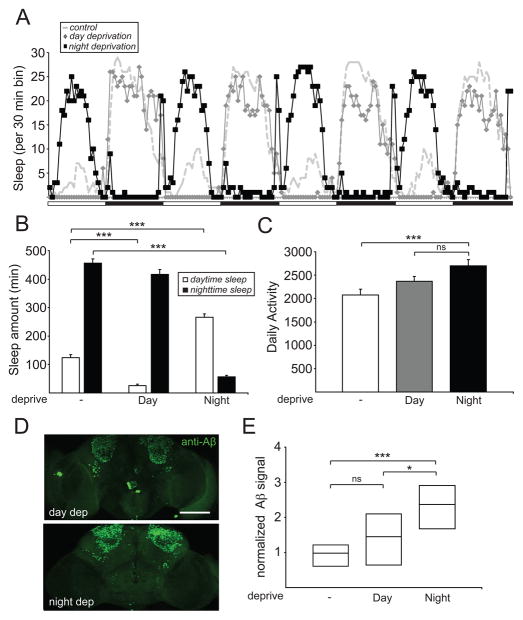
Figure 2. Mechanical sleep deprivation enhances Aβ burden.
(A) Sleep profile for OK107-Gal4>UAS-AβArctic flies undergoing no, daytime, or nighttime sleep deprivation from a representative experiment. White bars and black bars denote light and dark periods, respectively. Sleep amount (B) and daily activity (C) for OK107-Gal4>UAS-AβArctic flies, where “-”, “Day”, and “Night” denote no, daytime, and nighttime sleep deprivation, respectively. (D) Representative whole-mount brain confocal images for OK107-Gal4>UAS-AβArctic flies undergoing daytime (“day dep”) or nighttime (“night dep”) sleep deprivation, immunostained with anti-Aβ42 antibody (6E10). Maximum projection images are shown. (E) Normalized Aβ signal intensity in the MB KC from OK107-Gal4>UAS-AβArctic flies undergoing no (n=10), daytime (n=10), or nighttime (n=9) sleep deprivation. Aβ signal intensity is not normally distributed and is thus presented here and in subsequent figures as a simplified box plot with the median shown as the line inside the box, and the 75th and 25th percentiles shown as the top and bottom, respectively. Scale bar represents 100 μm.

