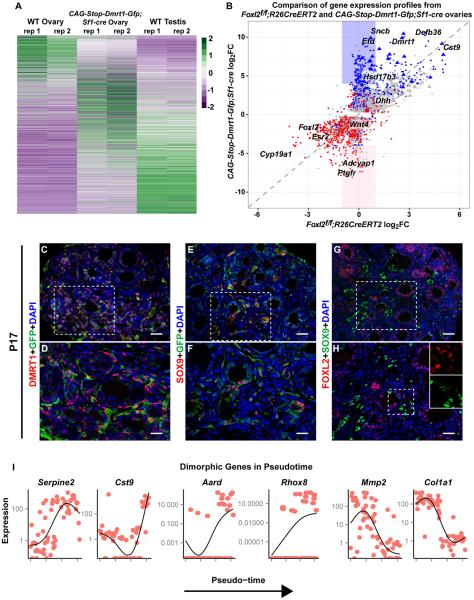
Figure 3. DMRT1 masculinizes the ovarian transcriptome.
(A) Heat map comparing mRNA expression in adult wild type testis and ovary with CAG--Dmrt1-Gfp;Sf1-Cre ovaries. Columns are from RNA-seq of two gonads (rep1, rep 2) of each genotype. Genes differentially expressed in wild type ovary and DMRT1-expressing ovary (>4-fold ; p<0.05, Table S1A) are shown in rows that are sorted based on high expression in the wild type ovary (top) to high expression in the testis (bottom). Each gene was normalized to a range of −2 (violet) to +2 (green). (B) Scatter plot comparing gene expression in adult Foxl2 conditionally mutant ovaries (data from [7]) and CAG-Stop-Dmrt1-Gfp;Sf1-Cre ovaries. Blue indicates mRNAs with 4-fold or greater expression in wild-type testis vs wild-type ovary and red indicates those with 4-fold or greater expression in wild-type ovary vs wild-type testis. Grey indicates mRNAs not differing significantly between testis and ovary. Identities of some of the most strongly affected mRNAs are indicated. Triangles denote X-linked genes and blue and pink boxes highlight mRNAs strongly up or down-regulated, respectively, in CAG-Dmrt1-Gfp expressing ovaries but not in Foxl2 mutant ovaries. (C-H) IF showing that P17 CAG-Stop-Dmrt1-Gfp;Sf1-Cre transgenic ovaries have a mix of GFP+ cells expressing DMRT1, SOX9, or FOXL2. Scale bars: 40 μm (C,E,G); 20 μm (D,F,H). (I) Expression levels (FPKM) of select mRNAs in single cells from P17 CAG-Stop-Dmrt1-Gfp;Sf1-Cre transgenic ovaries, ordered by pseudotime along the x-axis. See also Figure S3 and Table S1.

