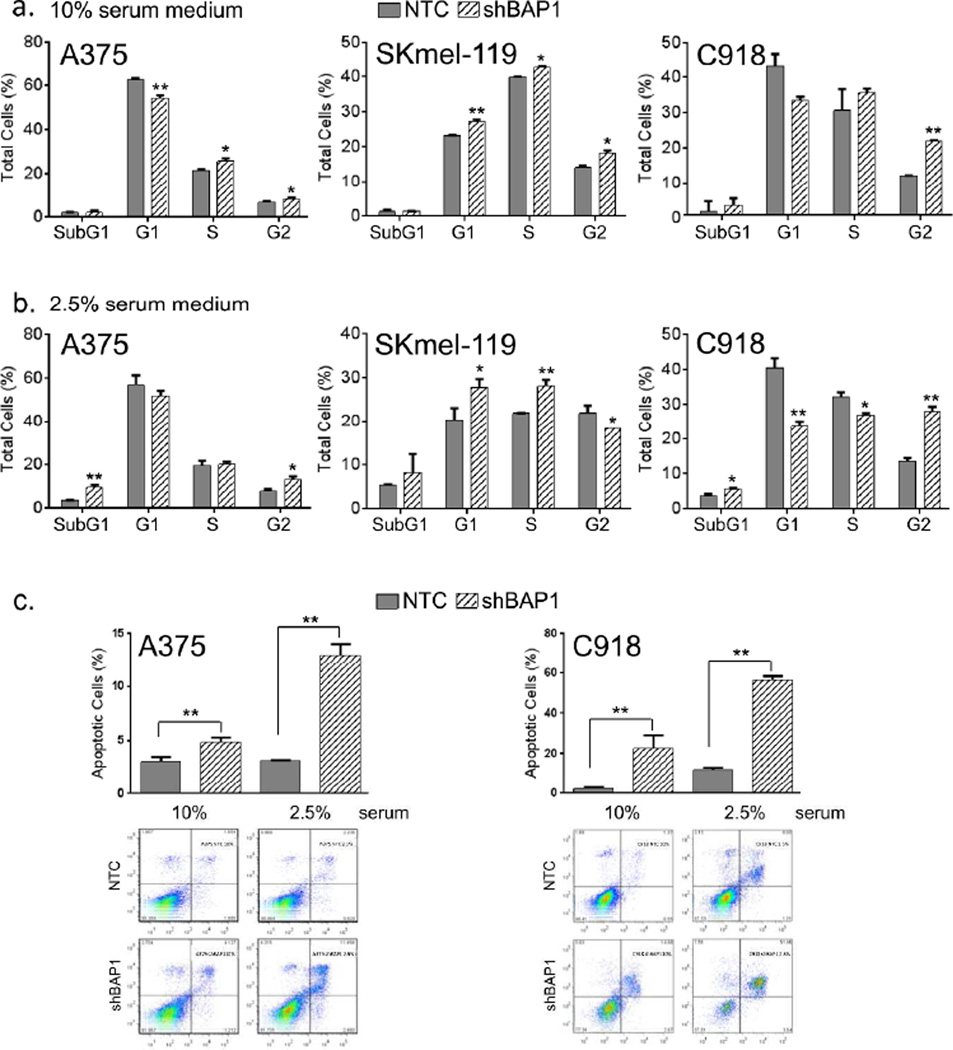
Figure 3. BAP1 depletion causes cell cycle arrest and apoptosis.
Analysis of cell cycle progression and apoptosis were performed at 6 or 7th day following shRNA-mediated BAP1 silencing. Cell cycle analysis in (a) 10% and (b) 2.5% serum medium using control cells (gray shading) and shBAP1 knockdown cells (hatched shading). Error bars represent SEM from triplicate samples and 3 experimental replicates are shown. A375 and SKmel-119 are cutaneous melanomas and C918 is an ocular melanoma used for comparison; *p<0.05, **p<0.01 by student T test. (c) FITC-Annexin staining of cultured control and BAP1-depleted cells in both 10% and 2.5% serum. DNA fragmentation may underestimate the level of apoptosis, especially if the total DNA content is elevated from G2/M arrest. Error bars represent SEM from triplicate samples both replicates shown; **p<0.01 by student T test.

