Figure 2.
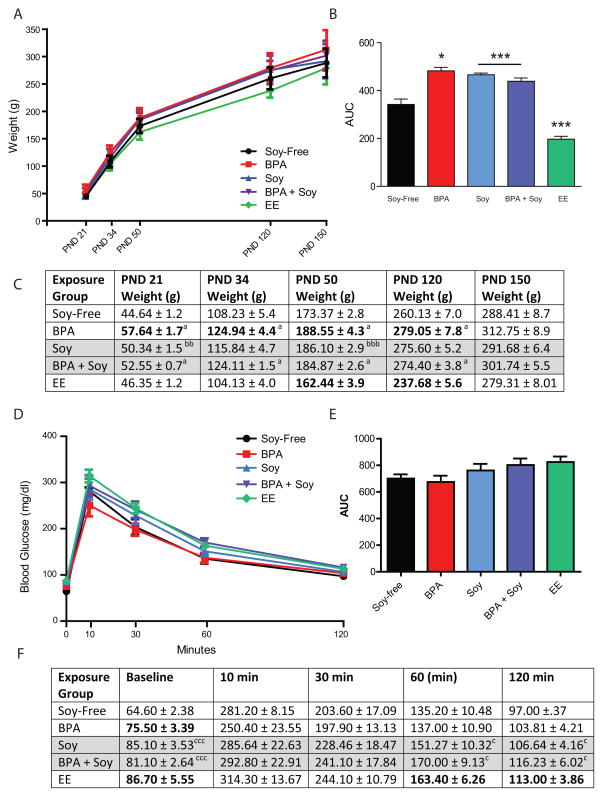
Body weight gain post-weaning. (A) Plotted weight gain between PNDs 21 and 150. (B) Area under the curve (AUC) was significantly greater in the soy fed animals, regardless of BPA exposure. Among the BPA-exposed animals, weight was only significantly elevated in the group reared on the soy-free diet. EE exposed animals were lighter than controls on the same (soy-free) diet. *P ≤ 0.05, ***P ≤ 0.001 (C) Body weights for each group at each age examined. Groups on the soy diet are shaded in gray. Bolded groups are significantly different than controls on the same diet. Main effects of BPA exposure were found for all ages except PND 150: aP ≤ 0.05, aaaP ≤ 0.001. No statistically significant main effect of soy diet was observed at any age in the 2-way ANOVA, but t-tests revealed that controls on soy diet were significantly heavier than controls on soy-free diet on PNDs 21 and 50: bbP ≤ 0.01, bbbP ≤ 0.001. EE animals were lighter than same-diet conspecifics on PNDs 50 and 120. (D) Plotted blood glucose levels across the 120 minute test. (E) No significant differences of diet, BPA or EE were found for glucose AUC but differences at the time points were observed and summarized in (F). Bolded groups are significantly different than controls on the same diet. Main effect of soy diet: cP ≤ 0.05, cccP ≤ 0.001

