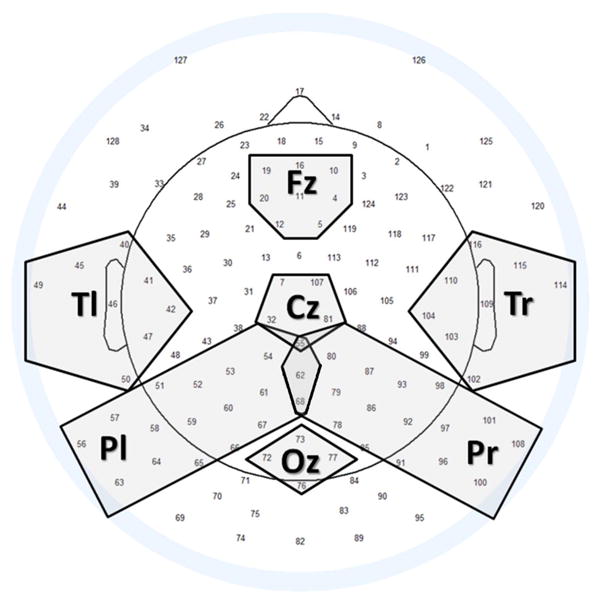
Fig. 1.


Maps of relative power spectra recorded in delta, theta and gamma band. Panels A, B, and C report relative power recorded during own and unfamiliar infant faces for delta, theta, and gamma frequency band, respectively. Significant differences between power levels measured during own and unfamiliar stimuli display: t*H (where t is the t test value and H is set to 0 or 1 in case of non significant or significant difference, respectively). Red indicates that activation for own infant faces is higher than for unfamiliar infant faces. Blue indicates that activation for unfamiliar infant faces is higher than for own infant faces. Color bar range of significant differences is equally set among all panels [from -4 to 4].
