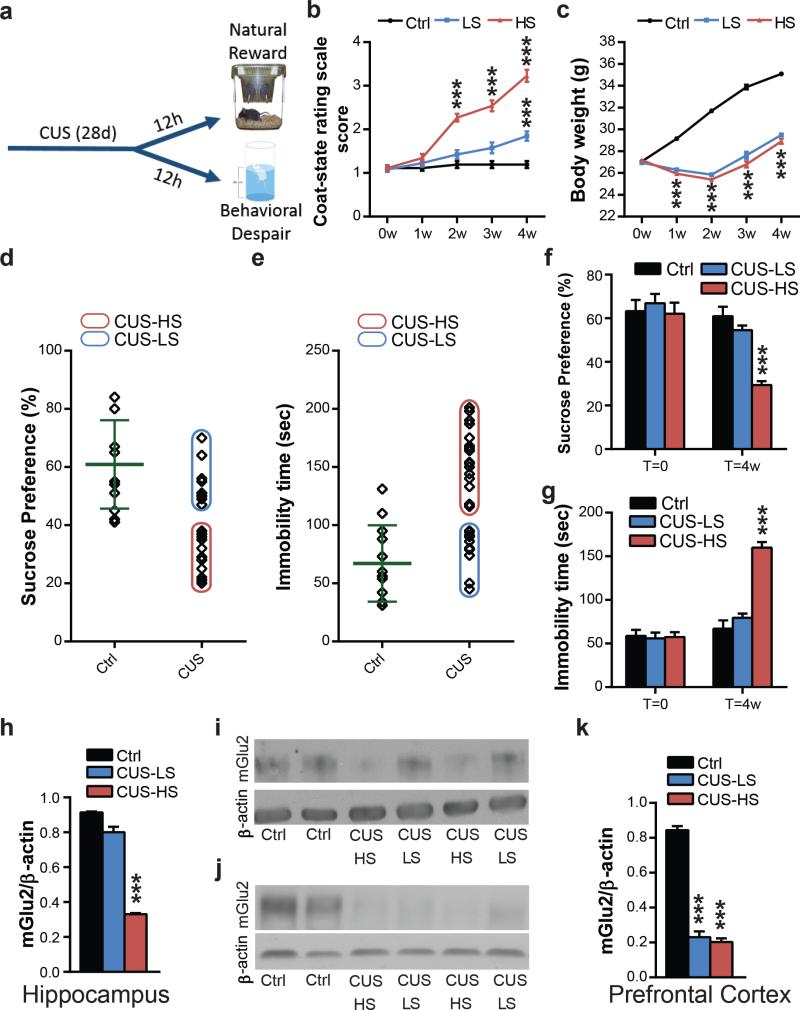
Figure 2. Chronic unpredictable stress results in more (HS) and less (LS) susceptible endophenotypes and in individual difference in mGlu2 receptor expression: a molecular signature of susceptibility.
a, Time course of the CUS and behavioral outcome analyses b, CUS results in a clear separation in HS and LS-endophenotypes at the coat-state rating scale for the evaluation of the CUS-induced coat deterioration (F14,375=47.19). c, Animal body weight over the four weeks of CUS (F14,375=206.5; F25,350=3.62). d and e, Identification of high and low-susceptible subgroups based on the immobility time at the sucrose intake (d) and at the forced swim test (e) in CUS-mice. Green lines indicate the mean (60.92 in d; 67.08 in e) and the standard deviation (in 15.20; 32.82 in c) of the control group. f, HS-mice show a lower sucrose intake at the sucrose preference test compared to LS wild-type mice subjected to CUS and unstressed mice (F5,66=11.61). g, HS-mice show a higher immobility time at the FST compared to LS wild-type mice subjected to CUS and unstressed mice (F5,74=40.67). Bars represent mean + SEM, * indicate significant comparisons to corresponding controls, ***p < 0.0001. h and i, Western blot analysis and representative blots of HS-mice show lower mGlu2 hippocampal receptor expression compared to CUS-LS mice and unstressed mice (F2,15=264.7). j and k, Western blot analysis and representative blots of mGlu2 receptor expression in the prefrontal cortex (F2,15=185.9) shows a strong impairment in both CUS-HS and CUS-LS mice compared to unstressed mice. Bars represent mean + SEM, * indicate significant comparisons to respective control groups, ***p < 0.0001.

