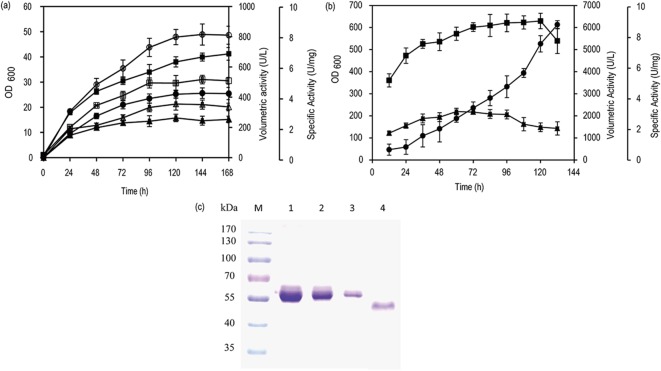
Fig 1. Time course of laccase production during shake flask cultivation and 10-L fed-batch fermentation.
(a) Progress curves constructed in the induction phase of shake flask cultivation for the determination of the cell density of P. pastoris/LacTT (closed square) and P. pastoris/(LacTT)4 (open square), volumetric activity of P. pastoris/LacTT (closed circle) and P. pastoris/(LacTT)4 (open circle), specific activity of P. pastoris/LacTT (closed triangle) and P. pastoris/(LacTT)4 (open triangle). (b) Cell density (closed square), volumetric activity (closed circle), and specific activity (closed triangle) of P. pastoris/(LacTT)4 in fed-batch fermentation. (c) SDS-PAGE image of LacTT supernatant expressed in P. pastoris/(LacTT)4 in fed-batch fermentation. Lane M: protein marker; Lane 1: 0.5 mg/mL BSA; Lane 2: 0.3 mg/mL BSA; Lane 3: 0.1 mg/mL BSA; Lane 4: Enzyme supernatant was 1:10 diluted. The error bars represent the standard deviation.

