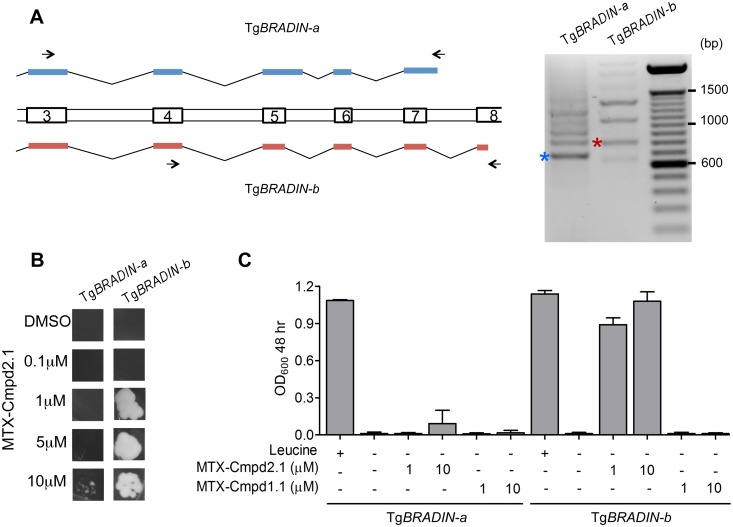
Fig 5. The TgBRADIN Y3H interaction with Compound 2 is isoform-specific.
A. Schematic showing exons 3–8 from two of the TgBRADIN isoforms generated by alternative splicing of TgBRADIN (see S1A Fig for schematic of the entire gene). Two PCRs are shown on the right using primers P7 and P8 for TgBRADIN-a and P17 and P18 for TgBRADIN-b (arrows). The bands marked with the asterisks correspond to the splicing pattern of either TgBRADIN-a (blue) or TgBRADIN-b (red, hit #4 from the Y3H screen) as determined by sequencing of the PCR products. B. The C-terminal half of the coding sequence corresponding to either TgBRADIN-a or TgBRADIN-b was tested in an in-plate growth assay (5 days at 30°C) with MTX-Cmpd2.1 at the concentrations shown. C. The same yeast expressing TgBRADIN-a or TgBRADIN-b were used in a liquid growth assay with MTX-Cmpd2.1 or MTX-Cmpd1.1 (a Compound 1-derived CID) (mean ± SD, n = 3).

