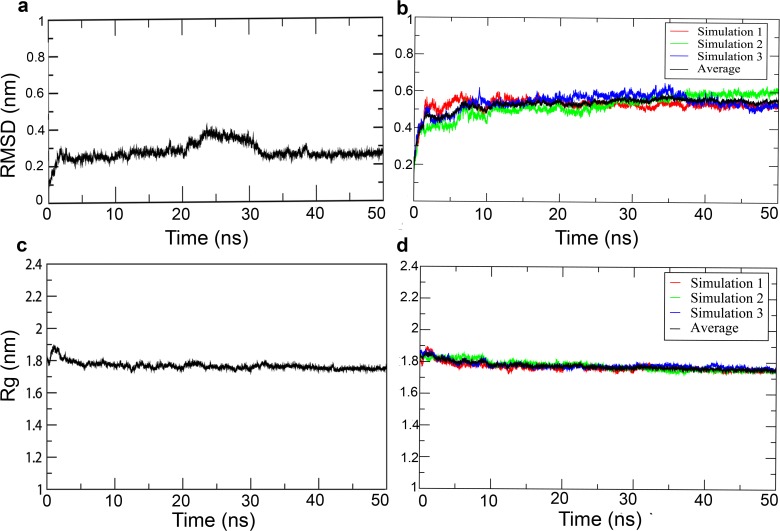
Fig 3. RMSD and radius of gyration (Rg) for DprE1 and DprE2 as a function of time.
(a) RMSD evolution of DprE1 (b) RMSD evolution of DprE2 in triplicate (c) Rg evolution of DprE1 and (d) Rg evolution of DprE2.in triplicate. In case of DprE2 red, green and blue represent the three simulations of 50 ns each.The black line represents the average of all three simulations.

