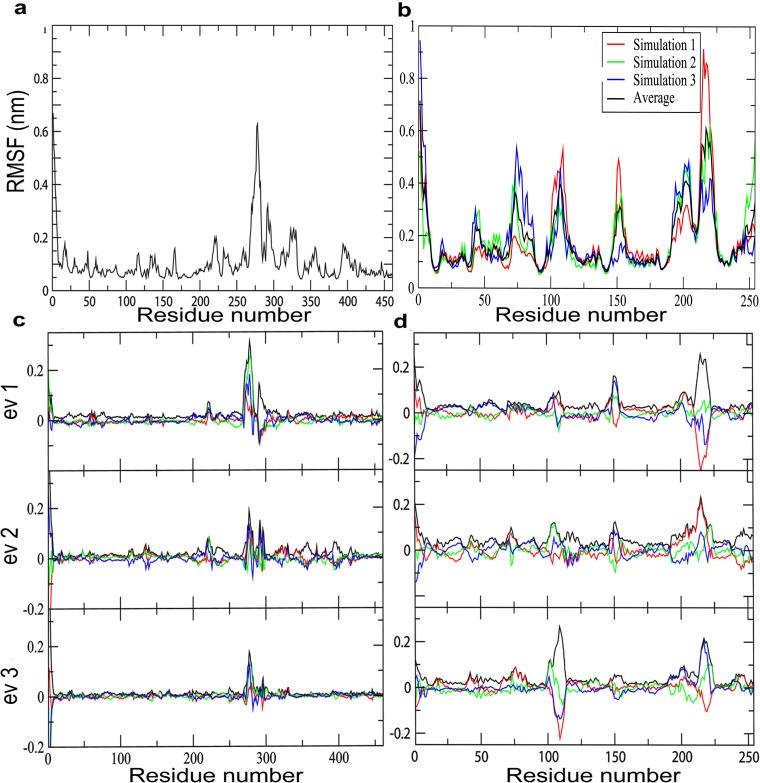
Fig 4. RMSF of the backbone Cα atoms versus time at 310 K for (a) DprE1 and (b) DprE2 triplicate simulation where the black line denotes the average of the three simulations.
In this graph, it is observed that each simulation shows similar RMSF pattern. Projection of the Cα atom trajectory along the first three eigenvectors for (c) DprE1 and (d) DprE2 giving a more clear view of the level of residue fluctuations. The graphs depict conformationally flexible regions 269–330 in DprE1 and 95–113, 146–157, and 197–226 in DprE2. The figure depicts the first three eigenvectors to capture the dominant fluctuations in the trajectory.

