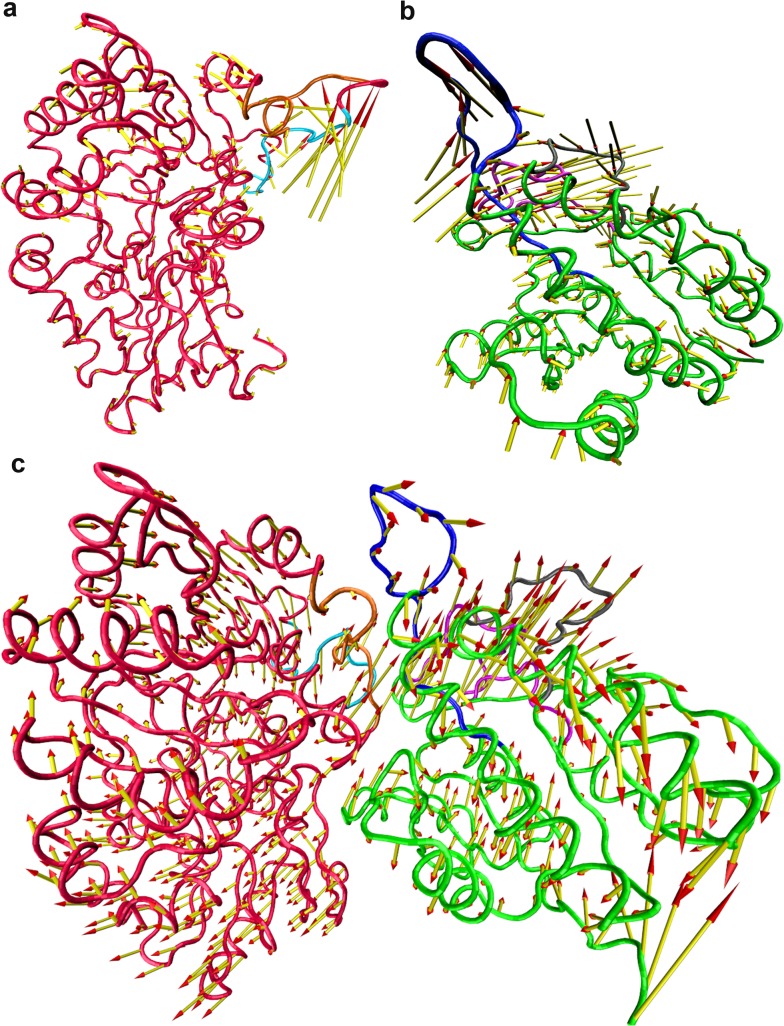
Fig 10. Porcupine plot analysis.
The porcupine plot of the first eigenvector of (a) DprE1, (b) DprE2 and (c) DprE1-DprE2 complex. The arrows indicate direction of eignvector and magnitude of the corresponding value. For DprE1, regions 262–275 and 279–291 are shown in cyan and orange respectively. For DprE2, blue, grey and pink represent reions 95–113, 146–157 and 202–226 respectively.

