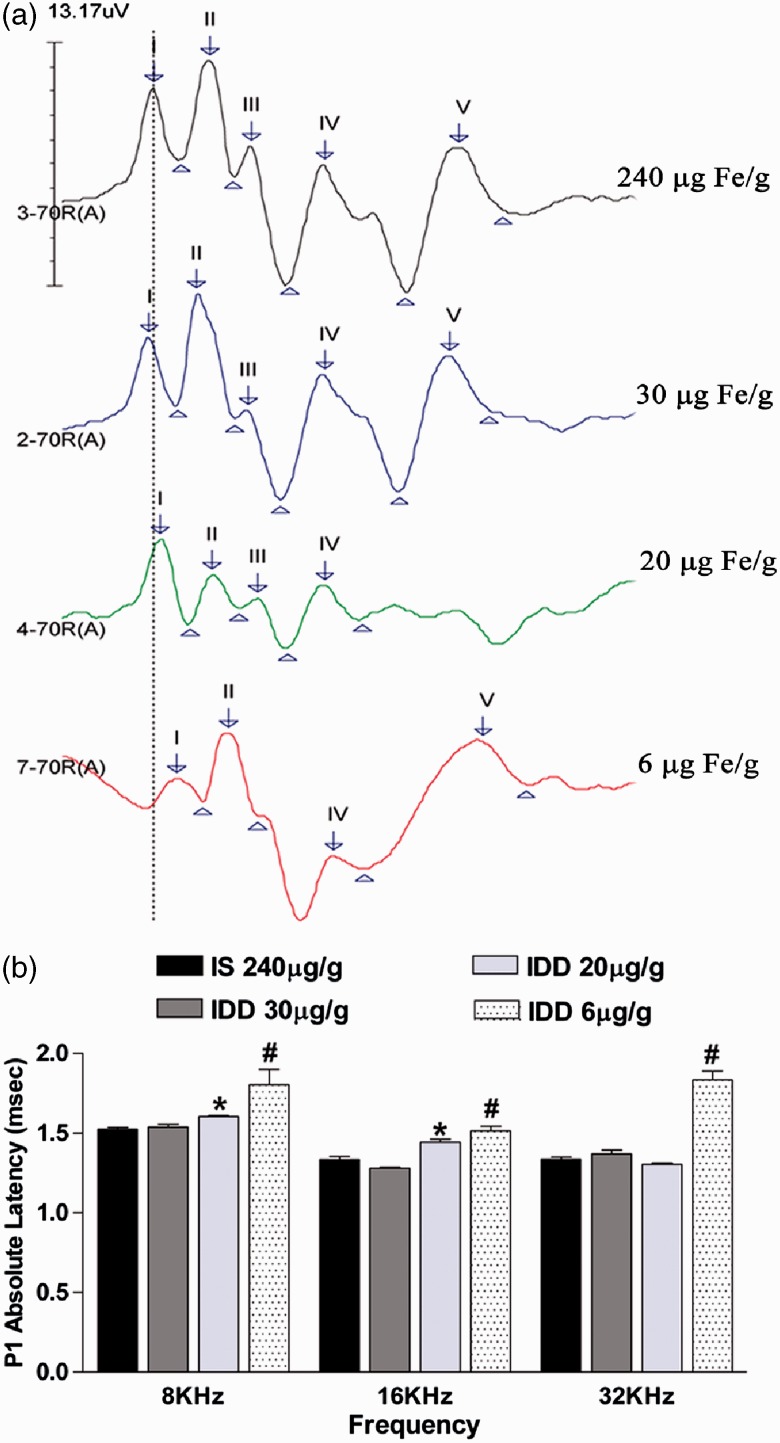
Figure 3.
Peak 1 neuronal conduction velocity by ABR analysis in P40 offspring fed variable IDDs. (a) Representative aligned ABR potentials evoked at 16 kHz stimulus frequency and 70 dB intensity level. The dotted line demarcates the relative latency of Peak 1 (P1) in IS controls compared with each IDD group. (b) Quantified latencies from all three test frequencies in each diet group. Data are mean ± SEM, n = IS: 11, IDD-30: 9, IDD-20: 13, IDD-6: 5 rats per group. *p < .05 versus frequency-matched IS controls, #p < .05 versus all diet groups within that frequency. IS = iron sufficient; IDD = iron-deficient diet.

