Fig. 3.
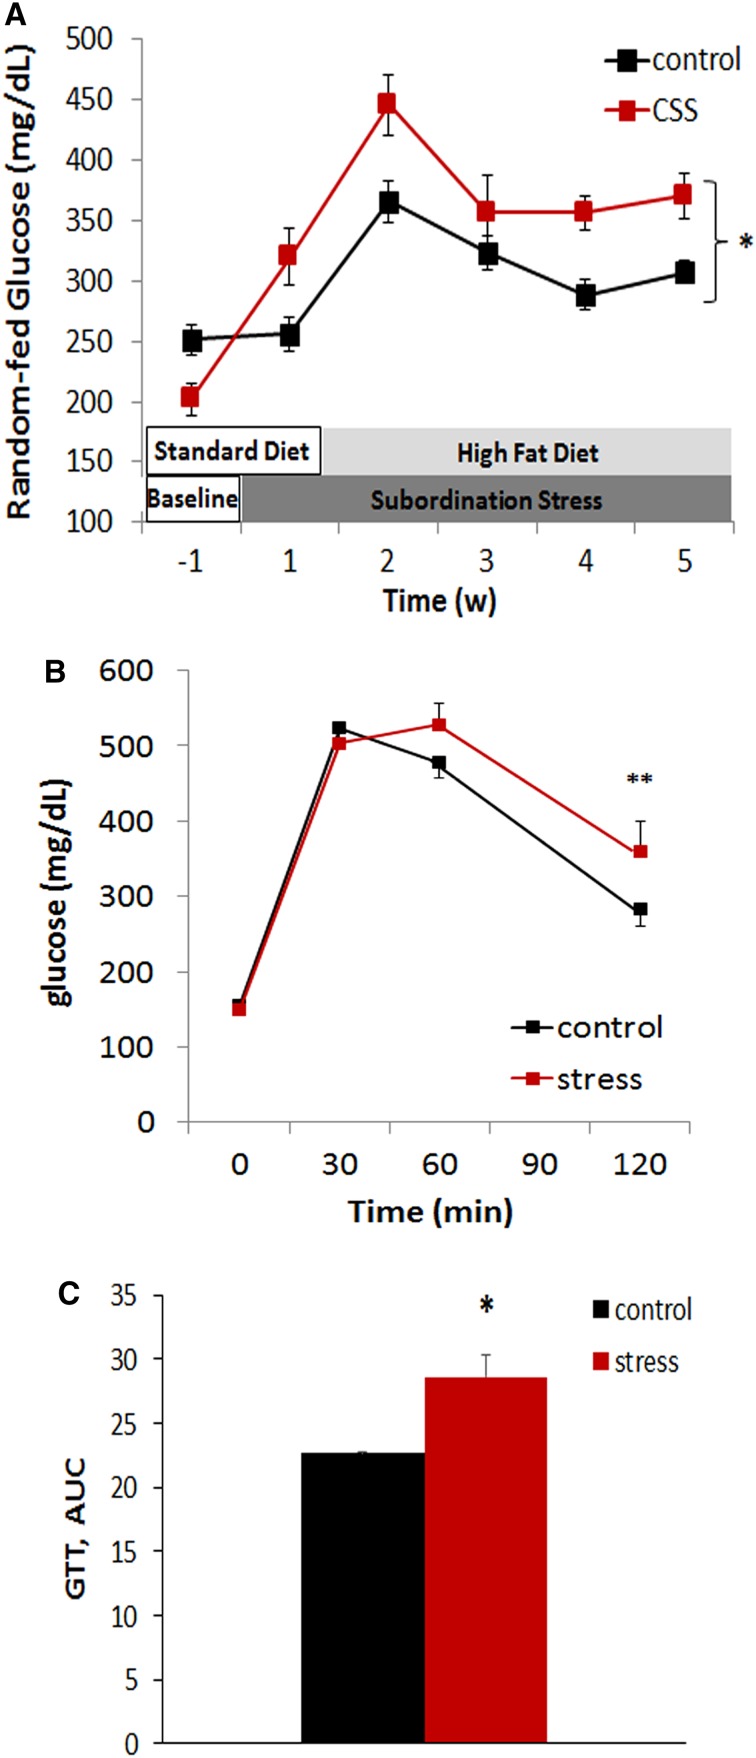
Glucose homeostasis is worsened in subordinate db/db mice. a Random-fed glucose levels were assessed between 08:30 am and 09:30 am weekly. b Glucose tolerance test (GTT). c Area under the curve (AUC) data for GTT were calculated and expressed as (mg/dl × 120 min, ×103). N = 17 control, N = 12 stress. Data are shown as mean and SEM. Symbols refers to post hoc test. **p < 0.01, *p < 0.05 versus control

